CASE STUDIES FROM AFRICA
30769-doc-services_exports_for_growth_and_development_africa
30769-doc-services_exports_for_growth_and_development_africa

Create successful ePaper yourself
Turn your PDF publications into a flip-book with our unique Google optimized e-Paper software.
significant share of services output in GDP. The unimpressive performance, an offshoot of<br />
inefficient and ineffective service delivery of the majority of the services subsectors was<br />
attributed to government restrictive policies embodied in long periods of market<br />
restrictions, dominant government ownership, use of obsolete technology, weak regulatory<br />
environment, and poor management. 4<br />
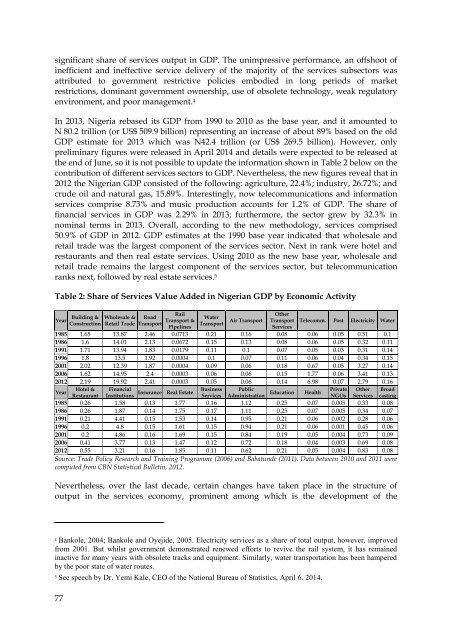
In 2013, Nigeria rebased its GDP from 1990 to 2010 as the base year, and it amounted to<br />
N 80.2 trillion (or US$ 509.9 billion) representing an increase of about 89% based on the old<br />
GDP estimate for 2013 which was N42.4 trillion (or US$ 269.5 billion). However, only<br />
preliminary figures were released in April 2014 and details were expected to be released at<br />
the end of June, so it is not possible to update the information shown in Table 2 below on the<br />
contribution of different services sectors to GDP. Nevertheless, the new figures reveal that in<br />
2012 the Nigerian GDP consisted of the following: agriculture, 22.4%; industry, 26.72%; and<br />
crude oil and natural gas, 15.89%. Interestingly, now telecommunications and information<br />
services comprise 8.73% and music production accounts for 1.2% of GDP. The share of<br />
financial services in GDP was 2.29% in 2013; furthermore, the sector grew by 32.3% in<br />
nominal terms in 2013. Overall, according to the new methodology, services comprised<br />
50.9% of GDP in 2012. GDP estimates at the 1990 base year indicated that wholesale and<br />
retail trade was the largest component of the services sector. Next in rank were hotel and<br />
restaurants and then real estate services. Using 2010 as the new base year, wholesale and<br />
retail trade remains the largest component of the services sector, but telecommunication<br />
ranks next, followed by real estate services. 5<br />
Table 2: Share of Services Value Added in Nigerian GDP by Economic Activity<br />
Year<br />
Building &<br />
Construction<br />
Wholesale &<br />
Retail Trade<br />
Road<br />
Transport<br />
Rail<br />
Transport &<br />
Pipelines<br />
Water<br />
Transport<br />
Air Transport<br />
Other<br />
Transport<br />
Services<br />
Telecomm. Post Electricity Water<br />
1985 1.65 13.87 2.46 0.0713 0.21 0.16 0.08 0.06 0.05 0.51 0.1<br />
1986 1.6 14.01 2.13 0.0672 0.15 0.13 0.08 0.06 0.05 0.32 0.11<br />
1991 1.71 13.94 1.83 0.0179 0.11 0.1 0.07 0.05 0.03 0.31 0.14<br />
1996 1.8 13.5 1.92 0.0004 0.1 0.07 0.11 0.06 0.04 0.34 0.15<br />
2001 2.02 12.39 1.87 0.0004 0.09 0.06 0.18 0.67 0.05 3.27 0.14<br />
2006 1.62 14.95 2.4 0.0003 0.06 0.06 0.15 1.77 0.06 3.41 0.13<br />
2012 2.19 19.92 2.41 0.0003 0.05 0.06 0.14 6.98 0.07 2.79 0.16<br />
Year<br />
Hotel &<br />
Restaurant<br />
Financial<br />
Institutions<br />
Insurance Real Estate<br />
Business<br />
Services<br />
Public<br />
Administration<br />
Education<br />
Health<br />
Private<br />
NGOs<br />
Other<br />
Services<br />
Broad<br />
casting<br />
1985 0.26 1.58 0.13 1.77 0.16 1.12 0.25 0.07 0.005 0.33 0.08<br />
1986 0.26 1.87 0.14 1.75 0.17 1.11 0.25 0.07 0.005 0.34 0.07<br />
1991 0.21 4.41 0.15 1.53 0.14 0.95 0.21 0.06 0.002 0.28 0.06<br />
1996 0.2 4.8 0.15 1.61 0.15 0.94 0.21 0.06 0.001 0.45 0.06<br />
2001 0.2 4.86 0.16 1.69 0.15 0.84 0.19 0.05 0.004 0.73 0.09<br />
2006 0.41 3.77 0.13 1.47 0.12 0.72 0.18 0.04 0.003 0.69 0.08<br />
2012 0.55 3.21 0.16 1.85 0.11 0.62 0.21 0.05 0.004 0.83 0.08<br />
Source: Trade Policy Research and Training Programme (2006) and Babatunde (2011). Data between 2010 and 2011 were<br />
computed from CBN Statistical Bulletin, 2012.<br />
Nevertheless, over the last decade, certain changes have taken place in the structure of<br />
output in the services economy, prominent among which is the development of the<br />
4<br />
Bankole, 2004; Bankole and Oyejide, 2005. Electricity services as a share of total output, however, improved<br />
from 2001. But whilst government demonstrated renewed efforts to revive the rail system, it has remained<br />
inactive for many years with obsolete tracks and equipment. Similarly, water transportation has been hampered<br />
by the poor state of water routes.<br />
5<br />
See speech by Dr. Yemi Kale, CEO of the National Bureau of Statistics, April 6. 2014.<br />
77