

Future of an Ageing Population
gs-16-10-future-of-an-ageing-population
gs-16-10-future-of-an-ageing-population

You also want an ePaper? Increase the reach of your titles
YUMPU automatically turns print PDFs into web optimized ePapers that Google loves.
<strong>Future</strong> <strong>of</strong> <strong>an</strong> <strong>Ageing</strong> <strong>Population</strong> | Health <strong>an</strong>d Care Systems<br />
Life expect<strong>an</strong>cy <strong>of</strong> men aged 65 (years)<br />
22<br />
20<br />
18<br />
16<br />
14<br />
12<br />
10<br />
8<br />
6<br />
4<br />
2<br />
0<br />
9.7 years in<br />
“Not Good<br />
health”<br />
1 2 3 4 5 6 7 8 9 10<br />
Most deprived<br />
Deciles <strong>of</strong> area deprivation<br />
7.9 years in<br />
“Not Good<br />
health”<br />
Least deprived<br />
Type <strong>of</strong> life expect<strong>an</strong>cy:<br />
Life expect<strong>an</strong>cy (LE)<br />
Healthy life expect<strong>an</strong>cy (HLE)<br />
Survey <strong>of</strong> 255,524<br />
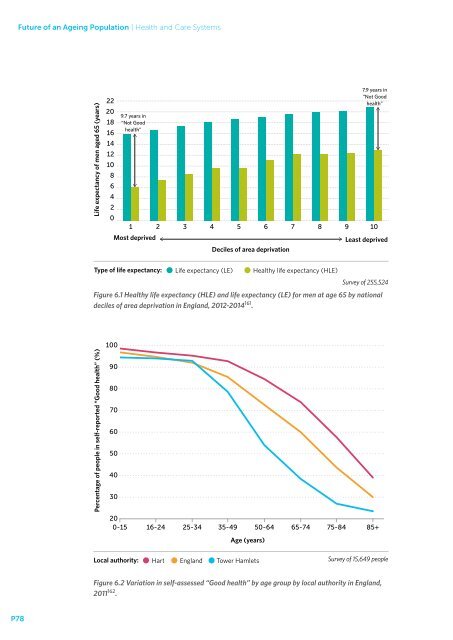
Figure 6.1 Healthy life expect<strong>an</strong>cy (HLE) <strong>an</strong>d life expect<strong>an</strong>cy (LE) for men at age 65 by national<br />
deciles <strong>of</strong> area deprivation in Engl<strong>an</strong>d, 2012-2014 161 .<br />
Percentage <strong>of</strong> people in self-reported “Good health” (%)<br />
100<br />
90<br />
80<br />
70<br />
60<br />
50<br />
40<br />
30<br />
20<br />
0-15 16-24 25-34 35-49 50-64 65-74 75-84 85+<br />
Age (years)<br />
Local authority:<br />
Hart Engl<strong>an</strong>d Tower Hamlets Survey <strong>of</strong> 15,649 people<br />
Figure 6.2 Variation in self-assessed “Good health” by age group by local authority in Engl<strong>an</strong>d,<br />
2011 162 .<br />
P78