

2007_6_Nr6_EEMJ

Create successful ePaper yourself
Turn your PDF publications into a flip-book with our unique Google optimized e-Paper software.
Robu et al. /Environmental Engineering and Management Journal 6 (<strong>2007</strong>), 6, 573-592<br />
to quantify the risks that arise from the activities<br />
considered, in the view of the results for<br />
environmental impacts. The risks are calculated<br />
follows (Eq.21):<br />
RM<br />
j<br />
= IM<br />
j<br />
⋅ Pj<br />
(21)<br />
ERj – environmental risk for environmental<br />
component j;<br />
EIj – environmental impact on environmental<br />
component j;<br />
Pj – probability of occurrence of impact on<br />
environmental component j.<br />
The probability of impact occurrence was<br />
calculated using the same matrix as described above<br />
(Table 1) to calculate the importance units. The<br />
normalized weights are presented in Table 4. The<br />
evaluator has to give values between 0 and 1 for<br />
probability (Table 3), which is detailed in Table 5<br />
(Pearce, 1999).<br />
7.3. Advantages and disadvantages<br />
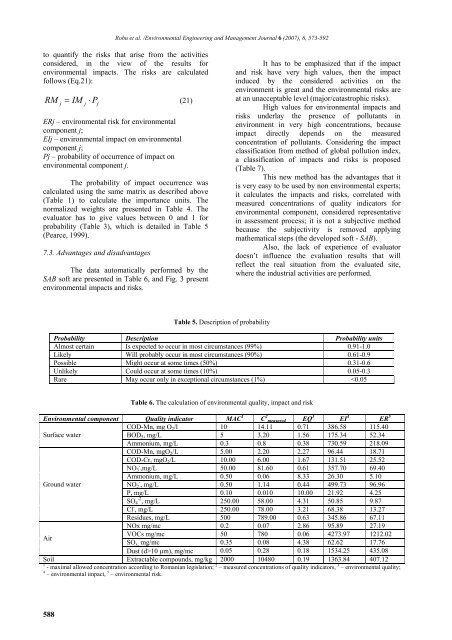
The data automatically performed by the<br />
SAB soft are presented in Table 6, and Fig. 3 present<br />
environmental impacts and risks.<br />
It has to be emphasized that if the impact<br />
and risk have very high values, then the impact<br />
induced by the considered activities on the<br />
environment is great and the environmental risks are<br />
at an unacceptable level (major/catastrophic risks).<br />
High values for environmental impacts and<br />
risks underlay the presence of pollutants in<br />
environment in very high concentrations, because<br />
impact directly depends on the measured<br />
concentration of pollutants. Considering the impact<br />
classification from method of global pollution index,<br />
a classification of impacts and risks is proposed<br />
(Table 7).<br />
This new method has the advantages that it<br />
is very easy to be used by non environmental experts;<br />
it calculates the impacts and risks, correlated with<br />
measured concentrations of quality indicators for<br />
environmental component, considered representative<br />
in assessment process; it is not a subjective method<br />
because the subjectivity is removed applying<br />
mathematical steps (the developed soft - SAB).<br />
Also, the lack of experience of evaluator<br />
doesn’t influence the evaluation results that will<br />
reflect the real situation from the evaluated site,<br />
where the industrial activities are performed.<br />
Table 5. Description of probability<br />
Probability Description Probability units<br />
Almost certain Is expected to occur in most circumstances (99%) 0.91-1.0<br />
Likely Will probably occur in most circumstances (90%) 0.61-0.9<br />
Possible Might occur at some times (50%) 0.31-0.6<br />
Unlikely Could occur at some times (10%) 0.05-0.3<br />
Rare May occur only in exceptional circumstances (1%) 10 µm), mg/mc 0.05 0.28 0.18 1534.25 435.08<br />
Soil Extractable compounds, mg/kg 2000 10480 0.19 1363.84 407.12<br />
1 - maximal allowed concentration according to Romanian legislation; 2 – measured concentrations of quality indicators, 3 – environmental quality;<br />
4 – environmental impact, 5 – environmental risk.<br />
588