Revista Tinerilor Economiºti (The Young Economists Journal)
Revista Tinerilor Economiºti (The Young Economists Journal)
Revista Tinerilor Economiºti (The Young Economists Journal)

Create successful ePaper yourself
Turn your PDF publications into a flip-book with our unique Google optimized e-Paper software.
<strong>Revista</strong> <strong>Tinerilor</strong> Economişti (<strong>The</strong> <strong>Young</strong> <strong>Economists</strong> <strong>Journal</strong>)<br />
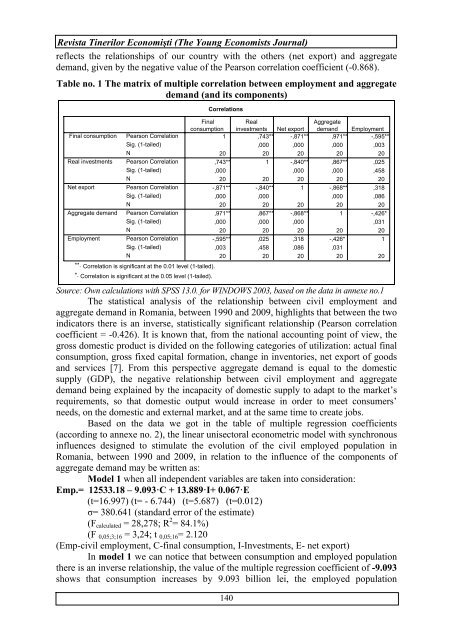
reflects the relationships of our country with the others (net export) and aggregate<br />
demand, given by the negative value of the Pearson correlation coefficient (-0.868).<br />
Table no. 1 <strong>The</strong> matrix of multiple correlation between employment and aggregate<br />
demand (and its components)<br />
Final consumption<br />
Real investments<br />
Net export<br />
Aggregate demand<br />
Employment<br />
Pearson Correlation<br />
Sig. (1-tailed)<br />
N<br />
Pearson Correlation<br />
Sig. (1-tailed)<br />
N<br />
Pearson Correlation<br />
Sig. (1-tailed)<br />
N<br />
Pearson Correlation<br />
Sig. (1-tailed)<br />
N<br />
Pearson Correlation<br />
Sig. (1-tailed)<br />
N<br />
**. Correlation is significant at the 0.01 level (1-tailed).<br />
*. Correlation is significant at the 0.05 level (1-tailed).<br />
Correlations<br />
Final<br />
Real<br />
Aggregate<br />
consumption investments Net export demand Employment<br />
1 ,743** -,871** ,971** -,595**<br />
,000 ,000 ,000 ,003<br />
20 20 20 20 20<br />
,743** 1 -,840** ,867** ,025<br />
,000 ,000 ,000 ,458<br />
20 20 20 20 20<br />
-,871** -,840** 1 -,868** ,318<br />
,000 ,000 ,000 ,086<br />
20 20 20 20 20<br />
,971** ,867** -,868** 1 -,426*<br />
,000 ,000 ,000 ,031<br />
20 20 20 20 20<br />
-,595** ,025 ,318 -,426* 1<br />
,003 ,458 ,086 ,031<br />
20 20 20 20 20<br />
Source: Own calculations with SPSS 13.0. for WINDOWS 2003, based on the data in annexe no.1<br />
<strong>The</strong> statistical analysis of the relationship between civil employment and<br />
aggregate demand in Romania, between 1990 and 2009, highlights that between the two<br />
indicators there is an inverse, statistically significant relationship (Pearson correlation<br />
coefficient = -0.426). It is known that, from the national accounting point of view, the<br />
gross domestic product is divided on the following categories of utilization: actual final<br />
consumption, gross fixed capital formation, change in inventories, net export of goods<br />
and services [7]. From this perspective aggregate demand is equal to the domestic<br />
supply (GDP), the negative relationship between civil employment and aggregate<br />
demand being explained by the incapacity of domestic supply to adapt to the market’s<br />
requirements, so that domestic output would increase in order to meet consumers’<br />
needs, on the domestic and external market, and at the same time to create jobs.<br />
Based on the data we got in the table of multiple regression coefficients<br />
(according to annexe no. 2), the linear unisectoral econometric model with synchronous<br />
influences designed to stimulate the evolution of the civil employed population in<br />
Romania, between 1990 and 2009, in relation to the influence of the components of<br />
aggregate demand may be written as:<br />
Model 1 when all independent variables are taken into consideration:<br />
Emp.= 12533.18 – 9.093·C + 13.889·I+ 0.067·E<br />
(t=16.997) (t= - 6.744) (t=5.687) (t=0.012)<br />
σ= 380.641 (standard error of the estimate)<br />
(Fcalculated = 28,278; R 2 = 84.1%)<br />
(F 0,05;3;16 = 3,24; t 0,05;16= 2.120<br />
(Emp-civil employment, C-final consumption, I-Investments, E- net export)<br />
In model 1 we can notice that between consumption and employed population<br />
there is an inverse relationship, the value of the multiple regression coefficient of -9.093<br />
shows that consumption increases by 9.093 billion lei, the employed population<br />
140