- Page 1 and 2:
Revista Tinerilor Economiºti Journ
- Page 3 and 4:
REVISTA TINERILOR ECONOMIŞTI ISSN
- Page 5 and 6:
What is happened when the rules are
- Page 7 and 8:
THE IMPORTANCE OF COMMUNICATION IN
- Page 10 and 11:
RECENT DEVELOPMENTS IN THE EU TAXAT
- Page 12 and 13:
At the end of the 1990-2000 decade,
- Page 14 and 15:
Regarding the tax burden related to
- Page 16 and 17:
Indirect taxes are defined as the s
- Page 18 and 19:
Source: Tax revenue in the European
- Page 20 and 21:
EVALUATION OF MANAGEMENT PERFORMANC
- Page 22 and 23:
cash flow statement may also be use
- Page 24 and 25:
epaying loans or reducing registere
- Page 26 and 27:
operating activity and partially fr
- Page 28 and 29:
FINANCIAL REPORTING IN PUBLIC INSTI
- Page 30 and 31:
Considering the leading role played
- Page 32 and 33:
Thus, public institutions prepare t
- Page 34 and 35:
� Financial reporting is a repres
- Page 36 and 37:
COMPARATIVE ANALYSIS CONCERNING THE
- Page 38 and 39:
In 2010, the number of large compan
- Page 40 and 41:
In order to compare the average val
- Page 42 and 43:
Figure no. 11 The structure of the
- Page 44 and 45:
Finances - Accounting THE APPROACH
- Page 46 and 47:
Finances - Accounting this guarante
- Page 48 and 49:
Finances - Accounting labor mobilit
- Page 50 and 51:
49 Finances - Accounting COHESION F
- Page 52 and 53:
Finances - Accounting governments.
- Page 54 and 55:
Finances - Accounting budget, provi
- Page 56 and 57:
Finances - Accounting 3. * * * Regu
- Page 58 and 59:
Management - Marketing - Tourism 2.
- Page 60 and 61:
Management - Marketing - Tourism 3.
- Page 62 and 63:
Management - Marketing - Tourism Mo
- Page 64 and 65:
ASPECTS REGARDING THE MARKETING ENV
- Page 66 and 67:
Management - Marketing - Tourism -
- Page 68 and 69:
Management - Marketing - Tourism a
- Page 70 and 71:
Management - Marketing - Tourism Su
- Page 72 and 73:
Management - Marketing - Tourism pu
- Page 74 and 75:
11. Homburg, C., Management - Marke
- Page 76 and 77:
UNDERSTANDING RISK MANAGEMENT IN SM
- Page 78 and 79:
Management - Marketing - Tourism or
- Page 80 and 81:
Management - Marketing - Tourism as
- Page 82 and 83:
26 Kotter J.P. , Cohen D.S. - Inima
- Page 84 and 85:
Management - Marketing - Tourism ch
- Page 86 and 87:
85 Management - Marketing - Tourism
- Page 88 and 89:
Management - Marketing - Tourism pr
- Page 90 and 91:
Management - Marketing - Tourism pr
- Page 92 and 93:
Management - Marketing - Tourism im
- Page 94 and 95:
Management - Marketing - Tourism ri
- Page 96 and 97:
Management - Marketing - Tourism It
- Page 98 and 99:
RISK MANAGEMENT IN BUSINESS Managem
- Page 100 and 101:
decision-making process. 30 99 Mana
- Page 102 and 103:
Management - Marketing - Tourism Ac
- Page 104 and 105:
7. Opran, C., Paraipan, L., Stan, S
- Page 106 and 107:
Management - Marketing - Tourism 3.
- Page 108 and 109:
Management - Marketing - Tourism Cr
- Page 110 and 111:
4. Ioniță Ion Management - Market
- Page 112 and 113:
Management - Marketing - Tourism vi
- Page 114 and 115:
Management - Marketing - Tourism pa
- Page 116 and 117:
Management - Marketing - Tourism pr
- Page 118 and 119:
Economic Theories - International E
- Page 120 and 121:
Economic Theories - International E
- Page 122 and 123:
Economic Theories - International E
- Page 124 and 125:
Economic Theories - International E
- Page 126 and 127:
Economic Theories - International E
- Page 128 and 129:
Economic Theories - International E
- Page 130 and 131:
Economic Theories - International E
- Page 132 and 133:
Economic Theories - International E
- Page 134 and 135:
Economic Theories - International E
- Page 136 and 137:
Economic Theories - International E
- Page 138 and 139:
Economic Theories - International E
- Page 140 and 141:
Economic Theories - International E
- Page 142 and 143: Economic Theories - International E
- Page 144 and 145: Economic Theories - International E
- Page 146 and 147: Economic Theories - International E
- Page 148 and 149: Economic Theories - International E
- Page 150 and 151: Economic Theories - International E
- Page 152 and 153: Indicators Economic Theories - Inte
- Page 154 and 155: Business Statistics - Economic Info
- Page 156 and 157: Business Statistics - Economic Info
- Page 158 and 159: Business Statistics - Economic Info
- Page 160 and 161: Business Statistics - Economic Info
- Page 162 and 163: Business Statistics - Economic Info
- Page 164 and 165: Business Statistics - Economic Info
- Page 166 and 167: Business Statistics - Economic Info
- Page 168 and 169: Business Statistics - Economic Info
- Page 170 and 171: Business Statistics - Economic Info
- Page 172 and 173: Business Statistics - Economic Info
- Page 174 and 175: Business Statistics - Economic Info
- Page 176 and 177: Business Statistics - Economic Info
- Page 178 and 179: Business Statistics - Economic Info
- Page 180 and 181: obligation. Business Statistics - E
- Page 182 and 183: Business Statistics - Economic Info
- Page 184 and 185: Business Statistics - Economic Info
- Page 186 and 187: Business Statistics - Economic Info
- Page 188 and 189: Business Statistics - Economic Info
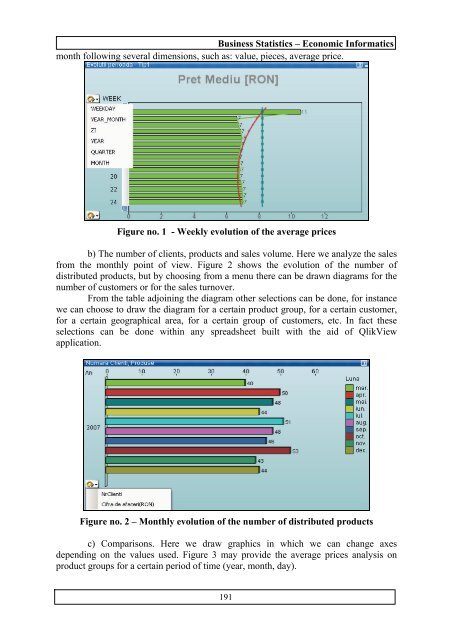
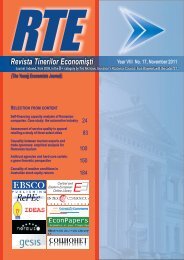
- Page 190 and 191: Business Statistics - Economic Info
- Page 194 and 195: Business Statistics - Economic Info
- Page 196 and 197: 2. Barrall I., Johnson, C., Trappe,
- Page 198: ISSN 1583-9982