Revista Tinerilor Economiºti (The Young Economists Journal)
Revista Tinerilor Economiºti (The Young Economists Journal)
Revista Tinerilor Economiºti (The Young Economists Journal)

You also want an ePaper? Increase the reach of your titles
YUMPU automatically turns print PDFs into web optimized ePapers that Google loves.
Indicators<br />
Economic <strong>The</strong>ories – International Economic Relations<br />
Share of employment<br />
in secondary and tertiary sectors<br />
(% total employment)<br />
151<br />
Share of Gross value added (GVA)<br />
in secondary and tertiary sectors<br />
(% total GVA)<br />
Latvia 83,8 85,6 95,9 90,8 93,5 98,8<br />
Lithuania 83,0 92,3 96,7 92,1 96,6 98,7<br />
Luxembourg 98,3 99,6<br />
Malta 97,7 97,5<br />
Netherlands 94,8 94,7 97,7 97,0 96,6 98,4<br />
Poland 72,6 88,0 96,2 90,2 96,2 99,0<br />
Portugal 76,8 86,7 97,3 94,6 96,4 99,3<br />
Slovakia 94,6 97,0 99,0 94,2 97,2 99,1<br />
Slovenia 86,5 93,9 95,9 98,4<br />
Spain 88,1 94,1 98,3 91,7 96,3 99,0<br />
Sweden 96,2 97,6 99,6 96,9 98,5 99,9<br />
United<br />
92,9 97,6 99,3 95,2 98,2 99,6<br />
Kingdom<br />
U15 91,2 96,2 98,8 95,9 97,8 99,4<br />
U27 85,8 93,7 98,6 95,4 97,6 99,4<br />
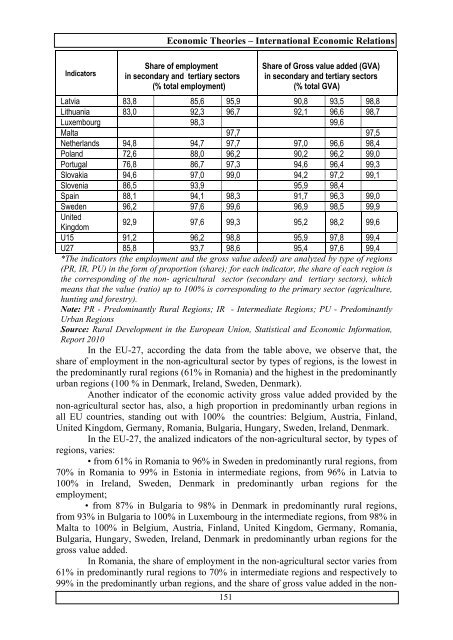
*<strong>The</strong> indicators (the employment and the gross value adeed) are analyzed by type of regions<br />
(PR, IR, PU) in the form of proportion (share); for each indicator, the share of each region is<br />
the corresponding of the non- agricultural sector (secondary and tertiary sectors), which<br />
means that the value (ratio) up to 100% is corresponding to the primary sector (agriculture,<br />
hunting and forestry).<br />
Note: PR - Predominantly Rural Regions; IR - Intermediate Regions; PU - Predominantly<br />
Urban Regions<br />
Source: Rural Development in the European Union, Statistical and Economic Information,<br />
Report 2010<br />
In the EU-27, according the data from the table above, we observe that, the<br />
share of employment in the non-agricultural sector by types of regions, is the lowest in<br />
the predominantly rural regions (61% in Romania) and the highest in the predominantly<br />
urban regions (100 % in Denmark, Ireland, Sweden, Denmark).<br />
Another indicator of the economic activity gross value added provided by the<br />
non-agricultural sector has, also, a high proportion in predominantly urban regions in<br />
all EU countries, standing out with 100% the countries: Belgium, Austria, Finland,<br />
United Kingdom, Germany, Romania, Bulgaria, Hungary, Sweden, Ireland, Denmark.<br />
In the EU-27, the analized indicators of the non-agricultural sector, by types of<br />
regions, varies:<br />
• from 61% in Romania to 96% in Sweden in predominantly rural regions, from<br />
70% in Romania to 99% in Estonia in intermediate regions, from 96% in Latvia to<br />
100% in Ireland, Sweden, Denmark in predominantly urban regions for the<br />
employment;<br />
• from 87% in Bulgaria to 98% in Denmark in predominantly rural regions,<br />
from 93% in Bulgaria to 100% in Luxembourg in the intermediate regions, from 98% in<br />
Malta to 100% in Belgium, Austria, Finland, United Kingdom, Germany, Romania,<br />
Bulgaria, Hungary, Sweden, Ireland, Denmark in predominantly urban regions for the<br />
gross value added.<br />
In Romania, the share of employment in the non-agricultural sector varies from<br />
61% in predominantly rural regions to 70% in intermediate regions and respectively to<br />
99% in the predominantly urban regions, and the share of gross value added in the non-