Revista Tinerilor Economiºti (The Young Economists Journal)
Revista Tinerilor Economiºti (The Young Economists Journal)
Revista Tinerilor Economiºti (The Young Economists Journal)

Create successful ePaper yourself
Turn your PDF publications into a flip-book with our unique Google optimized e-Paper software.
<strong>Revista</strong> <strong>Tinerilor</strong> Economişti (<strong>The</strong> <strong>Young</strong> <strong>Economists</strong> <strong>Journal</strong>)<br />
Index returns series have been found stationary for all conditions after taking first<br />
differences into account.<br />
<strong>The</strong> null hypothesis of a unit root has been rejected and that means that all the<br />
variables do not have the unit root problem and the series are stationary. Moreover,<br />
since all time series are stationary, the assumption is that the series is integrated in the<br />
order of one. <strong>The</strong> degree of co-integration 1 will be used as a lag coefficient in the<br />
causality test.<br />
4.3 ARCH/ GARCH Effects and Granger Causality Test<br />
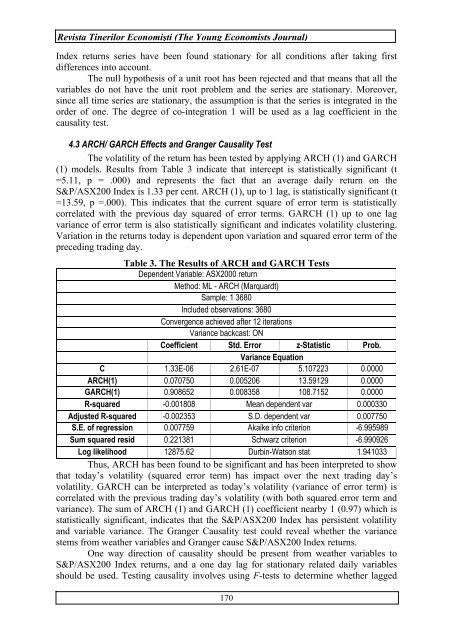
<strong>The</strong> volatility of the return has been tested by applying ARCH (1) and GARCH<br />
(1) models. Results from Table 3 indicate that intercept is statistically significant (t<br />
=5.11, p = .000) and represents the fact that an average daily return on the<br />
S&P/ASX200 Index is 1.33 per cent. ARCH (1), up to 1 lag, is statistically significant (t<br />
=13.59, p =.000). This indicates that the current square of error term is statistically<br />
correlated with the previous day squared of error terms. GARCH (1) up to one lag<br />
variance of error term is also statistically significant and indicates volatility clustering.<br />
Variation in the returns today is dependent upon variation and squared error term of the<br />
preceding trading day.<br />
Table 3. <strong>The</strong> Results of ARCH and GARCH Tests<br />
Dependent Variable: ASX2000 return<br />
Method: ML - ARCH (Marquardt)<br />
Sample: 1 3680<br />
Included observations: 3680<br />
Convergence achieved after 12 iterations<br />
Variance backcast: ON<br />
Coefficient Std. Error z-Statistic Prob.<br />
Variance Equation<br />
C 1.33E-06 2.61E-07 5.107223 0.0000<br />
ARCH(1) 0.070750 0.005206 13.59129 0.0000<br />
GARCH(1) 0.908652 0.008358 108.7152 0.0000<br />
R-squared -0.001808 Mean dependent var 0.000330<br />
Adjusted R-squared -0.002353 S.D. dependent var 0.007750<br />
S.E. of regression 0.007759 Akaike info criterion -6.995989<br />
Sum squared resid 0.221381 Schwarz criterion -6.990926<br />
Log likelihood 12875.62 Durbin-Watson stat 1.941033<br />
Thus, ARCH has been found to be significant and has been interpreted to show<br />
that today’s volatility (squared error term) has impact over the next trading day’s<br />
volatility. GARCH can be interpreted as today’s volatility (variance of error term) is<br />
correlated with the previous trading day’s volatility (with both squared error term and<br />
variance). <strong>The</strong> sum of ARCH (1) and GARCH (1) coefficient nearby 1 (0.97) which is<br />
statistically significant, indicates that the S&P/ASX200 Index has persistent volatility<br />
and variable variance. <strong>The</strong> Granger Causality test could reveal whether the variance<br />
stems from weather variables and Granger cause S&P/ASX200 Index returns.<br />
One way direction of causality should be present from weather variables to<br />
S&P/ASX200 Index returns, and a one day lag for stationary related daily variables<br />
should be used. Testing causality involves using F-tests to determine whether lagged<br />
170