- Page 1 and 2:
CITY OF WANNEROO ANNUAL REPORT 2014
- Page 3 and 4:
CONTENTS A message from the Mayor .
- Page 5 and 6:
The Annual Report charts our progre
- Page 7 and 8:
One important measure of our achiev
- Page 9 and 10:
WELCOME TO THE ANNUAL REPORT 2014/1
- Page 11 and 12:
THE CITY OF WANNEROO’S VISION AND
- Page 13 and 14:
CITY PROFILE The City of Wanneroo i
- Page 15 and 16:
The majority of this growth is expe
- Page 17 and 18:
FINANCIAL HEALTH OVERVIEW 2014/15 R
- Page 19 and 20:
OPERATING EXPENSES Operating expens
- Page 21 and 22:
Regional Sporting Complex Baseball
- Page 23 and 24:
Capital Expenditure Per Programme T
- Page 25 and 26:
FINANCIAL POSITION Assets ASSETS 20
- Page 27 and 28:
Operating Surplus Ratio This ratio
- Page 29 and 30:
SERVICE DELIVERY OVERVIEW The City
- Page 31 and 32:
City Council GOVERNANCE As one of A
- Page 33 and 34:
YOUR COUNCIL Mayor Tracey Roberts J
- Page 35 and 36:
Statement of Business Ethics The Ci
- Page 37 and 38:
Council Meetings Dates during 2014/
- Page 39 and 40:
DISBANDED COMMITTEES AND WORKING GR
- Page 41 and 42:
Community Engagement Why We Engage
- Page 43 and 44:
Local Business in Wanneroo Economic
- Page 45 and 46:
2015 JAN FEB MAR APRIL MAY JUNE Glo
- Page 47 and 48:
Corporate Governance Corporate gove
- Page 49 and 50:
Kingsway indoor stadium Strategic R
- Page 51 and 52:
INTERNAL AUDIT The City's internal
- Page 53 and 54:
INJURY MANAGEMENT The focus for Inj
- Page 55 and 56:
The Organisational Structure The Ci
- Page 57 and 58:
OUR EMPLOYEES The City of Wanneroo
- Page 59 and 60:
Staff by employment type (Number of
- Page 61 and 62:
OUR PERFORMANCE Lenore Road | ANNUA
- Page 63 and 64:
Level 1 provides for the 10-year St
- Page 65 and 66:
PILLARS AND STRATEGIC OBJECTIVES EN
- Page 67 and 68:
Community Satisfaction KPI 2012 201
- Page 69 and 70:
Koondoola Community Centre construc
- Page 71 and 72: Proposed Yanchep Surf Live Saving C
- Page 73 and 74: PROJECT DESCRIPTION Project Status
- Page 75 and 76: PROJECT DESCRIPTION Project Status
- Page 77 and 78: PROJECT DESCRIPTION Project Status
- Page 79 and 80: PROJECT DESCRIPTION Project Status
- Page 81 and 82: OPERATIONAL ACTIONS PERFORMANCE The
- Page 83 and 84: INTERESTING FACTS INTERESTING FACTS
- Page 85 and 86: Our major achievements in 2014/15 S
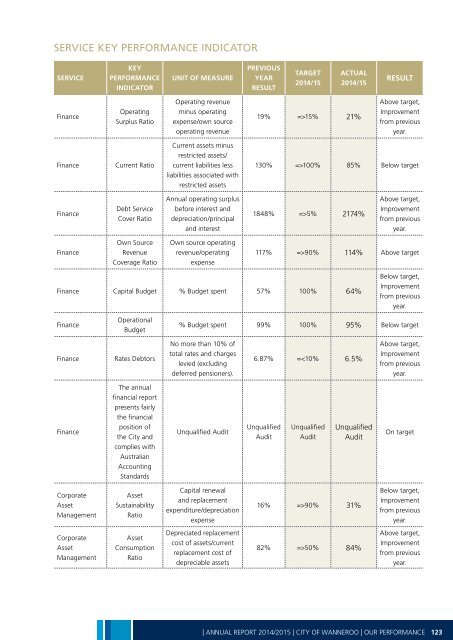
- Page 87 and 88: SERVICE KEY PERFORMANCE INDICATOR S
- Page 89 and 90: CBP REF NO. CBP ACTIONS PROJECT DEL
- Page 91 and 92: PILLAR: SOCIETY Aspiration: Healthy
- Page 93 and 94: ACHIEVEMENTS, CHALLENGES AND FUTURE
- Page 95 and 96: Clarkson Library Libraries Almost 1
- Page 97 and 98: Integrated Infrastructure & Utility
- Page 99 and 100: • Launch the Live Work Play Wanne
- Page 101 and 102: SERVICE KEY PERFORMANCE INDICATOR S
- Page 103 and 104: 4TH QUARTER (APRIL - JUNE 2015) CBP
- Page 105 and 106: 4TH QUARTER (APRIL - JUNE 2015) CBP
- Page 107 and 108: PILLAR: ECONOMY Aspiration: Progres
- Page 109 and 110: Looking Ahead - 2015/16 CBP Operati
- Page 111 and 112: 3.4 Smart communities Our major ach
- Page 113 and 114: SERVICE KEY PERFORMANCE INDICATOR S
- Page 115 and 116: 4TH QUARTER (APRIL - JUNE 2015) CBP
- Page 117 and 118: City Council PILLAR: CIVIC LEADERSH
- Page 119 and 120: Tri Cities Alliance with Hon. Julie
- Page 121: Customer Relations Centre at City C
- Page 125 and 126: CBP OPERATIONAL ACTIONS The table b
- Page 127 and 128: CBP REF NO. CBP ACTIONS PROJECT DEL
- Page 129 and 130: CBP REF NO. CBP ACTIONS PROJECT DEL
- Page 131 and 132: CBP REF NO. 4.3 u 4.3 v 4.3 x 4.3 y
- Page 133 and 134: Other land transactions DATE Septem
- Page 135 and 136: in implementing its social communit
- Page 137 and 138: FINANCIAL REPORT | ANNUAL REPORT 20
- Page 139 and 140: Financial Statements 2015 City of W
- Page 141 and 142: Financial Statements 2015 City of W
- Page 143 and 144: Financial Statements 2015 City of W
- Page 145 and 146: Financial Statements 2015 City of W
- Page 147 and 148: Financial Statements 2015 City of W
- Page 149 and 150: NOTES TO THE FINANCIAL STATEMENTS F
- Page 151 and 152: Financial Statements 2015 City of W
- Page 153 and 154: Financial Statements 2015 City of W
- Page 155 and 156: Financial Statements 2015 City of W
- Page 157 and 158: Financial Statements 2015 City of W
- Page 159 and 160: Financial Statements 2015 City of W
- Page 161 and 162: Financial Statements 2015 City of W
- Page 163 and 164: Financial Statements 2015 City of W
- Page 165 and 166: Financial Statements 2015 City of W
- Page 167 and 168: Financial Statements 2015 City of W
- Page 169 and 170: Financial Statements 2015 City of W
- Page 171 and 172: Financial Statements 2015 City of W
- Page 173 and 174:
Financial Statements 2015 Financial
- Page 175 and 176:
Financial Statements 2015 Financial
- Page 177 and 178:
Financial Statements 2015 City of W
- Page 179 and 180:
Financial Statements 2015 City of W
- Page 181 and 182:
Financial Statements 2015 City of W
- Page 183 and 184:
Financial Statements 2015 City of W
- Page 185 and 186:
Financial Statements 2015 City of W
- Page 187 and 188:
Financial Statements 2015 City of W
- Page 189 and 190:
Financial Statements 2015 City of W
- Page 191 and 192:
Financial Statements 2015 City of W
- Page 193 and 194:
Financial Statements 2015 City of W
- Page 195 and 196:
Financial Statements 2015 City of W
- Page 197 and 198:
Financial Statements 2015 City of W
- Page 199 and 200:
Financial Statements 2015 City of W
- Page 201 and 202:
Financial Statements 2015 City of W
- Page 203 and 204:
Financial Statements 2015 City of W
- Page 205 and 206:
Financial Statements 2015 Financial
- Page 207 and 208:
Financial Stateme Financial Stateme
- Page 209 and 210:
Financial Statements 2015 City of W
- Page 211 and 212:
Financial Statements 2015 City of W
- Page 213 and 214:
Financial Statements 2015 City of W
- Page 215 and 216:
Financial Statements 2015 City of W
- Page 217 and 218:
Financial Statements 2015 City of W
- Page 219 and 220:
Financial Statements 2015 City of W
- Page 221 and 222:
Financial Statements 2015 City of W
- Page 223 and 224:
Financial Statements 2015 City of W
- Page 225 and 226:
Financial Statements 2015 City of W
- Page 227 and 228:
Financial Statements 2015 City of W
- Page 229 and 230:
Financial Statements 2015 City of W
- Page 231 and 232:
Financial Statements 2015 City of W
- Page 233 and 234:
Financial Statements 2015 City of W
- Page 235 and 236:
Financial Statements 2015 City of W
- Page 237:
In making those risk assessments, t