
Create successful ePaper yourself
Turn your PDF publications into a flip-book with our unique Google optimized e-Paper software.
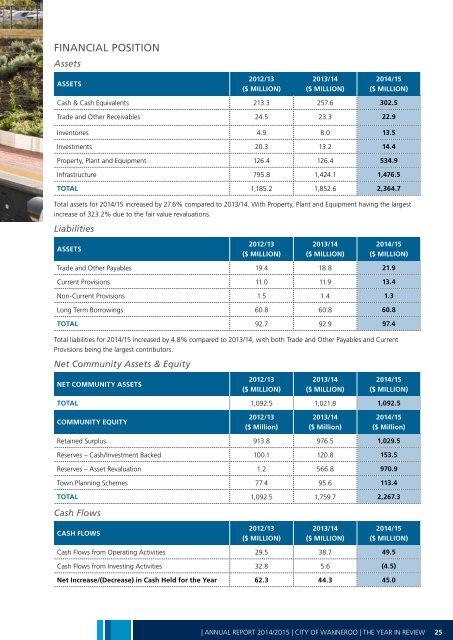
FINANCIAL POSITION<br />
Assets<br />
ASSETS<br />
2012/13<br />
($ MILLION)<br />
2013/14<br />
($ MILLION)<br />
<strong>2014</strong>/<strong>15</strong><br />
($ MILLION)<br />
Cash & Cash Equivalents 213.3 257.6 302.5<br />
Trade and Other Receivables 24.5 23.3 22.9<br />
Inventories 4.9 8.0 13.5<br />
Investments 20.3 13.2 14.4<br />
Property, Plant and Equipment 126.4 126.4 534.9<br />
Infrastructure 795.8 1,424.1 1,476.5<br />
TOTAL 1,185.2 1,852.6 2,364.7<br />
Total assets for <strong>2014</strong>/<strong>15</strong> increased by 27.6% compared to 2013/14. With Property, Plant and Equipment having the largest<br />
increase of 323.2% due to the fair value revaluations.<br />
Liabilities<br />
ASSETS<br />
2012/13<br />
($ MILLION)<br />
2013/14<br />
($ MILLION)<br />
<strong>2014</strong>/<strong>15</strong><br />
($ MILLION)<br />
Trade and Other Payables 19.4 18.8 21.9<br />
Current Provisions 11.0 11.9 13.4<br />
Non-Current Provisions 1.5 1.4 1.3<br />
Long Term Borrowings 60.8 60.8 60.8<br />
TOTAL 92.7 92.9 97.4<br />
Total liabilities for <strong>2014</strong>/<strong>15</strong> increased by 4.8% compared to 2013/14, with both Trade and Other Payables and Current<br />
Provisions being the largest contributors.<br />
Net Community Assets & Equity<br />
NET COMMUNITY ASSETS<br />
2012/13<br />
($ MILLION)<br />
2013/14<br />
($ MILLION)<br />
<strong>2014</strong>/<strong>15</strong><br />
($ MILLION)<br />
TOTAL 1,092.5 1,021.8 1,092.5<br />
COMMUNITY EQUITY<br />
2012/13<br />
($ Million)<br />
2013/14<br />
($ Million)<br />
<strong>2014</strong>/<strong>15</strong><br />
($ Million)<br />
Retained Surplus 913.8 976.5 1,029.5<br />
Reserves – Cash/Investment Backed 100.1 120.8 <strong>15</strong>3.5<br />
Reserves – Asset Revaluation 1.2 566.8 970.9<br />
Town Planning Schemes 77.4 95.6 113.4<br />
TOTAL 1,092.5 1,759.7 2,267.3<br />
Cash Flows<br />
CASH FLOWS<br />
2012/13<br />
($ MILLION)<br />
2013/14<br />
($ MILLION)<br />
<strong>2014</strong>/<strong>15</strong><br />
($ MILLION)<br />
Cash Flows from Operating Activities 29.5 38.7 49.5<br />
Cash Flows from Investing Activities 32.8 5.6 (4.5)<br />
Net Increase/(Decrease) in Cash Held for the Year 62.3 44.3 45.0<br />
| ANNUAL REPORT <strong>2014</strong>/20<strong>15</strong> | CITY OF WANNEROO | THE YEAR IN REVIEW<br />
25