
You also want an ePaper? Increase the reach of your titles
YUMPU automatically turns print PDFs into web optimized ePapers that Google loves.
INJURY MANAGEMENT<br />
The focus for Injury Management has been to instil positive<br />
behaviours and practices in relation to how injuries are<br />
managed in the workplace.<br />
Areas of corporate focus include drug and alcohol processes,<br />
a pre-employment medical procedure, and training and<br />
education for leaders on how to effectively manage and<br />
support injured workers.<br />
At an operational level, a number of achievements have<br />
been made, including a significant increase in sit-stand desk<br />
provision (provide employees with the option to sit or stand<br />
at their workstations) to administrative personnel, and the<br />
rolling out of wide scale manual handling training.<br />
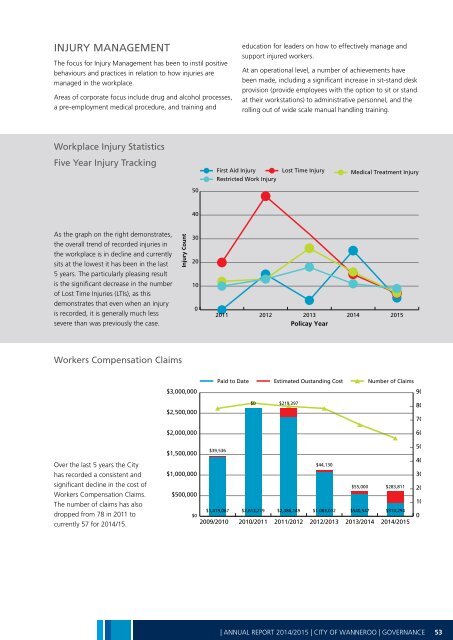
Workplace Injury Statistics<br />
Five Year Injury Tracking<br />
First Aid Injury Lost Time Injury Medical Treatment Injury<br />
Restricted Work Injury<br />
50<br />
40<br />
As the graph on the right demonstrates,<br />
the overall trend of recorded injuries in<br />
the workplace is in decline and currently<br />
sits at the lowest it has been in the last<br />
5 years. The particularly pleasing result<br />
is the significant decrease in the number<br />
of Lost Time Injuries (LTIs), as this<br />
demonstrates that even when an injury<br />
is recorded, it is generally much less<br />
severe than was previously the case.<br />
Injury Count<br />
30<br />
20<br />
10<br />
0<br />
2011 2012 2013 <strong>2014</strong> 20<strong>15</strong><br />
Policay Year<br />
Workers Compensation Claims<br />
$3,000,000<br />
Paid to Date Estimated Oustanding Cost Number of Claims<br />
90<br />
$2,500,000<br />
$2,000,000<br />
$0 $219,297<br />
80<br />
70<br />
60<br />
Over the last 5 years the City<br />
has recorded a consistent and<br />
significant decline in the cost of<br />
Workers Compensation Claims.<br />
The number of claims has also<br />
dropped from 78 in 2011 to<br />
currently 57 for <strong>2014</strong>/<strong>15</strong>.<br />
50<br />
$39,536<br />
$1,500,000<br />
40<br />
$44,130<br />
$1,000,000<br />
30<br />
$55,000 $283,811 20<br />
$500,000<br />
10<br />
$1,419,067 $2,613,219 $2,386,149 $1,083,012 $540,547 $314,294<br />
$0 0<br />
2009/2010 2010/2011 2011/2012 2012/2013 2013/<strong>2014</strong> <strong>2014</strong>/20<strong>15</strong><br />
| ANNUAL REPORT <strong>2014</strong>/20<strong>15</strong> | CITY OF WANNEROO | GOVERNANCE<br />
53