
You also want an ePaper? Increase the reach of your titles
YUMPU automatically turns print PDFs into web optimized ePapers that Google loves.
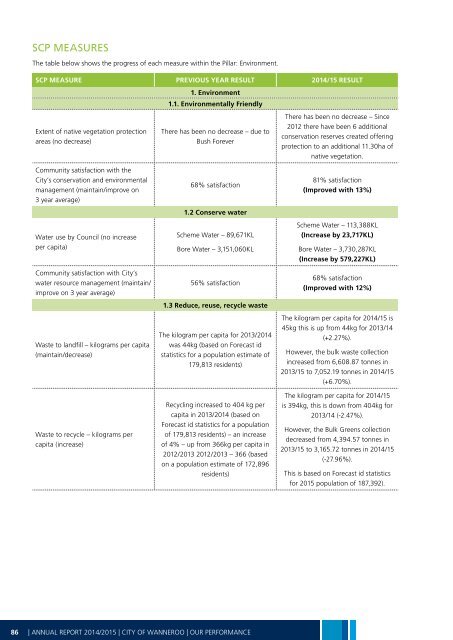
SCP MEASURES<br />
The table below shows the progress of each measure within the Pillar: Environment.<br />
SCP MEASURE PREVIOUS YEAR RESULT <strong>2014</strong>/<strong>15</strong> RESULT<br />
Extent of native vegetation protection<br />
areas (no decrease)<br />
1. Environment<br />
1.1. Environmentally Friendly<br />
There has been no decrease – due to<br />
Bush Forever<br />
There has been no decrease – Since<br />
2012 there have been 6 additional<br />
conservation reserves created offering<br />
protection to an additional 11.30ha of<br />
native vegetation.<br />
Community satisfaction with the<br />
City’s conservation and environmental<br />
management (maintain/improve on<br />
3 year average)<br />
Water use by Council (no increase<br />
per capita)<br />
Community satisfaction with City’s<br />
water resource management (maintain/<br />
improve on 3 year average)<br />
Waste to landfill – kilograms per capita<br />
(maintain/decrease)<br />
Waste to recycle – kilograms per<br />
capita (increase)<br />
68% satisfaction<br />
1.2 Conserve water<br />
Scheme Water – 89,671KL<br />
Bore Water – 3,<strong>15</strong>1,060KL<br />
56% satisfaction<br />
1.3 Reduce, reuse, recycle waste<br />
The kilogram per capita for 2013/<strong>2014</strong><br />
was 44kg (based on Forecast id<br />
statistics for a population estimate of<br />
179,813 residents)<br />
Recycling increased to 404 kg per<br />
capita in 2013/<strong>2014</strong> (based on<br />
Forecast id statistics for a population<br />
of 179,813 residents) – an increase<br />
of 4% – up from 366kg per capita in<br />
2012/2013 2012/2013 – 366 (based<br />
on a population estimate of 172,896<br />
residents)<br />
81% satisfaction<br />
(Improved with 13%)<br />
Scheme Water – 113,388KL<br />
(Increase by 23,717KL)<br />
Bore Water – 3,730,287KL<br />
(Increase by 579,227KL)<br />
68% satisfaction<br />
(Improved with 12%)<br />
The kilogram per capita for <strong>2014</strong>/<strong>15</strong> is<br />
45kg this is up from 44kg for 2013/14<br />
(+2.27%).<br />
However, the bulk waste collection<br />
increased from 6,608.87 tonnes in<br />
2013/<strong>15</strong> to 7,052.19 tonnes in <strong>2014</strong>/<strong>15</strong><br />
(+6.70%).<br />
The kilogram per capita for <strong>2014</strong>/<strong>15</strong><br />
is 394kg, this is down from 404kg for<br />
2013/14 (-2.47%).<br />
However, the Bulk Greens collection<br />
decreased from 4,394.57 tonnes in<br />
2013/<strong>15</strong> to 3,165.72 tonnes in <strong>2014</strong>/<strong>15</strong><br />
(-27.96%).<br />
This is based on Forecast id statistics<br />
for 20<strong>15</strong> population of 187,392).<br />
86 | ANNUAL REPORT <strong>2014</strong>/20<strong>15</strong> | CITY OF WANNEROO | OUR PERFORMANCE