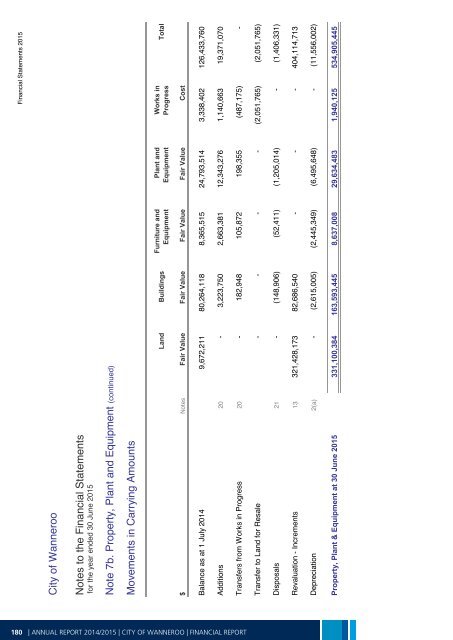
Financial Statements 20<strong>15</strong> Financial Statements 20<strong>15</strong> City of Wanneroo Notes to the Financial Statements for the year ended 30 June 20<strong>15</strong> Note 7b. Property, Plant and Equipment (continued) Movements in Carrying Amounts Land Buildings Furniture and Equipment Plant and Equipment Works in Progress Total $ Notes Fair Value Fair Value Fair Value Fair Value Cost Balance as at 1 July <strong>2014</strong> 9,672,211 80,264,118 8,365,5<strong>15</strong> 24,793,514 3,338,402 126,433,760 Additions 20 - 3,223,750 2,663,381 12,343,276 1,140,663 19,371,070 Transfers from Works in Progress 20 - 182,948 105,872 198,355 (487,175) - Transfer to Land for Resale - - - - (2,051,765) (2,051,765) Disposals 21 - (148,906) (52,411) (1,205,014) - (1,406,331) Revaluation - Increments 13 321,428,173 82,686,540 - - - 404,114,713 Depreciation 2(a) - (2,6<strong>15</strong>,005) (2,445,349) (6,495,648) - (11,556,002) Property, Plant & Equipment at 30 June 20<strong>15</strong> 331,100,384 163,593,445 8,637,008 29,634,483 1,940,125 534,905,445 page 43 page 43 180 | ANNUAL REPORT <strong>2014</strong>/20<strong>15</strong> | CITY OF WANNEROO | FINANCIAL REPORT
Financial Statements 20<strong>15</strong> City of Wanneroo Notes to the Financial Statements for the year ended 30 June 20<strong>15</strong> Note 8a. Infrastructure $ Notes 20<strong>15</strong> <strong>2014</strong> Actual Actual Roads - Fair Value Roads - Additions after valuation - Cost Less Accumulated Depreciation 941,546,322 941,546,322 48,122,690 - (13,444,529) - 976,224,483 941,546,322 Drainage - Fair Value Drainage - Additions after valuation - Cost Less Accumulated Depreciation 181,191,341 181,191,341 7,396,938 - (2,381,096) - 186,207,183 181,191,341 Other Infrastructure - Fair Value Other Infrastructure - Cost Less Accumulated Amortisation 49,390,650 49,390,650 3,850,957 - (3,855,128) - 49,386,479 49,390,650 Pathways - Fair Value Pathways - Additions after valuation - Cost Less Accumulated Amortisation 95,218,417 95,218,417 5,331,505 - (1,823,470) - 98,726,452 95,218,417 Car Parks - Fair Value Car Parks - Additions after valuation - Cost Less Accumulated Amortisation 9,681,370 9,681,370 1,376,953 - (675,890) - 10,382,433 9,681,370 Reserves - Fair Value Reserves - Additions after valuation - Cost Less Accumulated Amortisation 145,743,118 145,743,118 12,363,914 - (3,558,638) - <strong>15</strong>4,548,394 145,743,118 Works in Progress - Cost 982,608 1,322,683 982,608 1,322,683 Total Infrastructure 8(b) 1,476,458,032 1,424,093,901 The fair value of infrastructure is determined at least every three years in accordance with legislative requirements. Additions since the date of valuation are shown as cost, given they were acquired at arms length and any accumulated depreciation reflects the usage of service potential, it is considered the recorded written down value approximates fair value. At the end of each intervening period the valuation is reviewed and where appropriate the fair value is updated to reflect current conditions. This process is considered to be in accordance with Local Government (Financial Management) Regulation 17A (2) which requires infrastructure to be shown at fair value. page 44 | ANNUAL REPORT <strong>2014</strong>/20<strong>15</strong> | CITY OF WANNEROO | FINANCIAL REPORT 181