atw - International Journal for Nuclear Power | 2.2024
Internationale Entwicklungen und Trends
Internationale Entwicklungen und Trends

You also want an ePaper? Increase the reach of your titles
YUMPU automatically turns print PDFs into web optimized ePapers that Google loves.
Environment and Safety<br />
63<br />
dosimetry(EVND) and the upper part of the sur veillance<br />
capsule monitor bias factors(BE/C) are 1.06 and<br />
0.97. Combined bias factor (BE/C) is 1.01. In the case of<br />
the OPR-1000 results, the upper part of the Ex-vessel<br />
neutron dosimetry(EVND) and the upper part of<br />
the surveillance capsule monitor bias factors(BE/C)<br />
are 1.11 and 1.02. Combined bias factor (BE/C) is 1.06.<br />
Both Westinghouse 3-loop and OPR-1000 results<br />
meet within the range of ±20% of the acceptance<br />
criteria applied when comparing the measured and<br />
calculated values specified in Regulatory Guide 1.190 [6] .<br />
As a result, the reliability of the neutron fluence<br />
evaluation at reactor pressure vessel nozzle using<br />
upper part of surveillance capsule monitor and Exvessel<br />
neutron dosimetry (EVND) is confirmed. Both<br />
Westinghouse 3-loop and OPR-1000 results using<br />
upper part of surveillance capsule monitor and Exvessel<br />
neutron dosimetry(EVND) are higher than<br />
mid- plane data. As a result, the nozzle neutron fluence<br />
when nozzle region bias factor is evaluated<br />
conservatively.<br />
3.2 Neutron fluence of reactor pressure vessel<br />
nozzle<br />
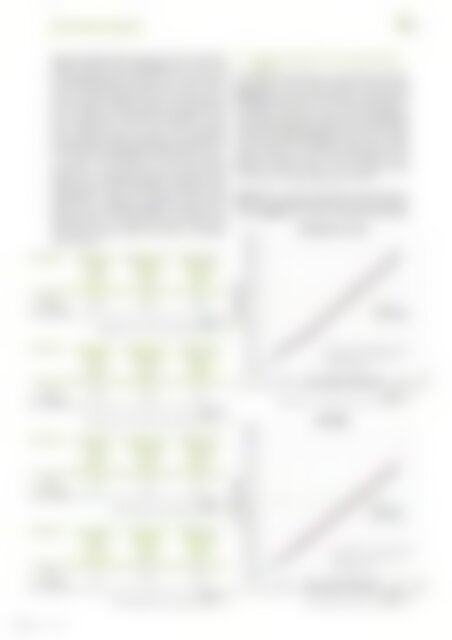
The nozzle neutron fluence was evaluated at the lowest<br />
weld region of the reactor pressure vessel nozzle.<br />
(Figure 6) shows the neutron fluence evaluated with<br />
the different bias factors at the nozzle with respect to<br />
the effective full power years of the Westinghouse<br />
3-loop. The projected neutron fluence <strong>for</strong> Westinghouse<br />
3-loop nozzle will be greater than 1×10 17 n/cm² (1 > MeV)<br />
at the time of 36EFPY. (Figure 7) shows the projected<br />
neutron fluence of the nozzle with respect to the<br />
effective full power years of the OPR-1000. And the<br />
projected neutron fluence will be greater than<br />
1×10 17 n/cm² (1 > MeV) at the time of 41EFPY.<br />
(Figure 8) is a graph comparing the neutron fluence<br />
of the core region and the nozzle of the Westinghouse<br />
3-loop. (Figure 9) is a graph comparing the neutron<br />
Parameter<br />
Midplane of<br />
EVND<br />
Midplane of SC<br />
Monitor<br />
EVND and SC<br />
Combined<br />
Average<br />
BE/C<br />
Average<br />
BE/C<br />
Average<br />
BE/C<br />
Flux<br />
(E > 1.0 MeV)<br />
0.92 0.93 0.93<br />
Tab. 2.<br />
Westinghouse 3-loop BE/C using Mid-plane Data<br />
Parameter<br />
Upper part of<br />
EVND<br />
Upper part of<br />
SC Monitor<br />
EVND and SC<br />
Combined<br />
Average<br />
BE/C<br />
Average<br />
BE/C<br />
Average<br />
BE/C<br />
Flux<br />
(E > 1.0 MeV)<br />
1.06 0.97 1.01<br />
Tab. 3.<br />
Westinghouse 3-loop RPV BE/C using Upper Part Data<br />
Fig. 6.<br />
Westinghouse 3-loop RPV nozzle neutron fluence<br />
Parameter<br />
Upper part of<br />
EVND<br />
Upper part of<br />
SC Monitor<br />
EVND and SC<br />
Combined<br />
Average<br />
BE/C<br />
Average<br />
BE/C<br />
Average<br />
BE/C<br />
Flux<br />
(E > 1.0 MeV)<br />
1.04 1.03 1.04<br />
Tab. 4.<br />
OPR-1000 RPV BE/C using Mid-plane Data<br />
Parameter<br />
Upper part of<br />
EVND<br />
Upper part of<br />
Monitor<br />
EVND and SC<br />
Combined<br />
Average<br />
BE/C<br />
Average<br />
BE/C<br />
Average<br />
BE/C<br />
Flux<br />
(E > 1.0 MeV)<br />
1.11 1.02 1.06<br />
Tab. 5.<br />
OPR-1000 RPV BE/C using Upper Part Data<br />
Fig. 7.<br />
OPR-1000 RPV nozzle neutron fluence<br />
Vol. 69 (2024)