Back Room Front Room 2
Back Room Front Room 2
Back Room Front Room 2

You also want an ePaper? Increase the reach of your titles
YUMPU automatically turns print PDFs into web optimized ePapers that Google loves.
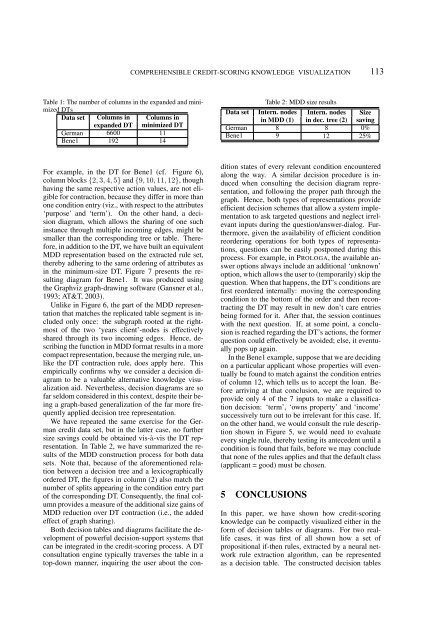
Table 1: The number of columns in the expanded and minimized<br />
DTs<br />
Data set Columns in Columns in<br />
expanded DT minimized DT<br />
German 6600 11<br />
Bene1 192 14<br />
For example, in the DT for Bene1 (cf. Figure 6),<br />
column blocks {2, 3, 4, 5} and {9, 10, 11, 12}, though<br />
having the same respective action values, are not eligible<br />
for contraction, because they differ in more than<br />
one condition entry (viz., with respect to the attributes<br />
‘purpose’ and ‘term’). On the other hand, a decision<br />
diagram, which allows the sharing of one such<br />
instance through multiple incoming edges, might be<br />
smaller than the corresponding tree or table. Therefore,<br />
in addition to the DT, we have built an equivalent<br />
MDD representation based on the extracted rule set,<br />
thereby adhering to the same ordering of attributes as<br />
in the minimum-size DT. Figure 7 presents the resulting<br />
diagram for Bene1. It was produced using<br />
the Graphviz graph-drawing software (Gansner et al.,<br />
1993; AT&T, 2003).<br />
Unlike in Figure 6, the part of the MDD representation<br />
that matches the replicated table segment is included<br />
only once: the subgraph rooted at the rightmost<br />
of the two ‘years client’-nodes is effectively<br />
shared through its two incoming edges. Hence, describing<br />
the function in MDD format results in a more<br />
compact representation, because the merging rule, unlike<br />
the DT contraction rule, does apply here. This<br />
empirically confirms why we consider a decision diagram<br />
to be a valuable alternative knowledge visualization<br />
aid. Nevertheless, decision diagrams are so<br />
far seldom considered in this context, despite their being<br />
a graph-based generalization of the far more frequently<br />
applied decision tree representation.<br />
We have repeated the same exercise for the German<br />
credit data set, but in the latter case, no further<br />
size savings could be obtained vis-à-vis the DT representation.<br />
In Table 2, we have summarized the results<br />
of the MDD construction process for both data<br />
sets. Note that, because of the aforementioned relation<br />
between a decision tree and a lexicographically<br />
ordered DT, the figures in column (2) also match the<br />
number of splits appearing in the condition entry part<br />
of the corresponding DT. Consequently, the final column<br />
provides a measure of the additional size gains of<br />
MDD reduction over DT contraction (i.e., the added<br />
effect of graph sharing).<br />
Both decision tables and diagrams facilitate the development<br />
of powerful decision-support systems that<br />
can be integrated in the credit-scoring process. A DT<br />
consultation engine typically traverses the table in a<br />
top-down manner, inquiring the user about the con-<br />
COMPREHENSIBLE CREDIT-SCORING KNOWLEDGE VISUALIZATION<br />
Table 2: MDD size results<br />
Data set Intern. nodes Intern. nodes Size<br />
in MDD (1) in dec. tree (2) saving<br />
German 8 8 0%<br />
Bene1 9 12 25%<br />
dition states of every relevant condition encountered<br />
along the way. A similar decision procedure is induced<br />
when consulting the decision diagram representation,<br />
and following the proper path through the<br />
graph. Hence, both types of representations provide<br />
efficient decision schemes that allow a system implementation<br />
to ask targeted questions and neglect irrelevant<br />
inputs during the question/answer-dialog. Furthermore,<br />
given the availability of efficient condition<br />
reordering operations for both types of representations,<br />
questions can be easily postponed during this<br />
process. For example, in PROLOGA, the available answer<br />
options always include an additional ‘unknown’<br />
option, which allows the user to (temporarily) skip the<br />
question. When that happens, the DT’s conditions are<br />
first reordered internally: moving the corresponding<br />
condition to the bottom of the order and then recontracting<br />
the DT may result in new don’t care entries<br />
being formed for it. After that, the session continues<br />
with the next question. If, at some point, a conclusion<br />
is reached regarding the DT’s actions, the former<br />
question could effectively be avoided; else, it eventually<br />
pops up again.<br />
In the Bene1 example, suppose that we are deciding<br />
on a particular applicant whose properties will eventually<br />
be found to match against the condition entries<br />
of column 12, which tells us to accept the loan. Before<br />
arriving at that conclusion, we are required to<br />
provide only 4 of the 7 inputs to make a classification<br />
decision: ‘term’, ‘owns property’ and ‘income’<br />
successively turn out to be irrelevant for this case. If,<br />
on the other hand, we would consult the rule description<br />
shown in Figure 5, we would need to evaluate<br />
every single rule, thereby testing its antecedent until a<br />
condition is found that fails, before we may conclude<br />
that none of the rules applies and that the default class<br />
(applicant = good) must be chosen.<br />
5 CONCLUSIONS<br />
113<br />
In this paper, we have shown how credit-scoring<br />
knowledge can be compactly visualized either in the<br />
form of decision tables or diagrams. For two reallife<br />
cases, it was first of all shown how a set of<br />
propositional if-then rules, extracted by a neural network<br />
rule extraction algorithm, can be represented<br />
as a decision table. The constructed decision tables