Back Room Front Room 2
Back Room Front Room 2
Back Room Front Room 2

Create successful ePaper yourself
Turn your PDF publications into a flip-book with our unique Google optimized e-Paper software.
128 ENTERPRISE INFORMATION SYSTEMS VI<br />
tion task; then, the neural models for organ failure<br />
diagnosis are introduced; next, a description of the<br />
different experiments performed is given, being the<br />
results analyzed and discussed; finally, closing conclusions<br />
are drawn.<br />
2 MATERIALS AND METHODS<br />
2.1 Clinical Data<br />
In this work, a part of the EURICUS II database<br />
(www.frice.nl) was adopted which contains data<br />
related to 5355 patients from 42 ICUs and 9 European<br />
Union countries, collected during a period of 10<br />
months, from 1998 to 1999. The database has one entry<br />
(or example) per each day (with a total of 30570),<br />
being its main features described in Table 1:<br />
• The first six rows denote the SOFA values (one for<br />
each organ) of the patient’s condition in the previous<br />
day. In terms of notation, these will be denoted<br />
by SOFAd−1, where d represents the current day.<br />
• The case mix appears in the next four rows, an information<br />
that remains unchanged during the patient’s<br />
internment, containing: the admission type<br />
(1 - Non scheduled surgery, 2 - Scheduled surgery,<br />
3 - Physician); the admission origin (1 - Surgery<br />
block, 2 - Recovery room, 3 - Emergency room, 4<br />
- Nursing room, 5 - Other ICU, 6 - Other hospital,<br />
7 - Other sources); the SAPSII score (a mortality<br />
prediction index, where higher values suggest a<br />
high death probability) and the patient’s age. Figure<br />
1 shows the frequency distributions of these attributes.<br />
• Finally, the last four rows denote the intermediate<br />
outcomes, which are triggered from four monitored<br />
biometrics: the systolic Blood Pressure (BP); the<br />
Heart Rate (HR); theOxygen saturation (O2); and<br />
the URine Output (UR). A panel of EURICUS II<br />
experts defined the normal ranges for these four<br />
variables (Tables 2 and 3). Each event (or critical<br />
event) is defined as a binary variable, which will be<br />
set to 0 (false), if the physiologic value lies within<br />
the advised range; or 1 (true) else, according to the<br />
time criterion.<br />
Before attempting modeling, the data was preprocessed,<br />
in order to set the desired classification outputs.<br />
First, six new attributes were created, by sliding<br />
the SOFAd−1 values into each previous example,<br />
since the intention is to predict the patient’s condition<br />
(SOFAd) with the available data at day d<br />
(SOFAd−1, case mix and adverse events). Then,<br />
the last day of the patient’s admission entries were<br />
discarded (remaining a total of 25309), since in this<br />
cases, no SOFAd information is available. Finally,<br />
the new attributes were transformed into binary variables,<br />
according to the expression:<br />
0 , if SOFAd < 3 (false, no organ failure)<br />
1 , else (true, organ dysfunction)<br />
(1)<br />
2.2 Neural Networks<br />
In MultiLayer Perceptrons, one of the most popular<br />
Neural Network architectures, neurons are grouped<br />
into layers and only forward connections exist<br />
(Bishop, 1995). Supervised learning is achieved by<br />
an iterative adjustment of the network connection<br />
weights (the training procedure), in order to minimize<br />
an error function, computed over the training examples<br />
(cases).<br />
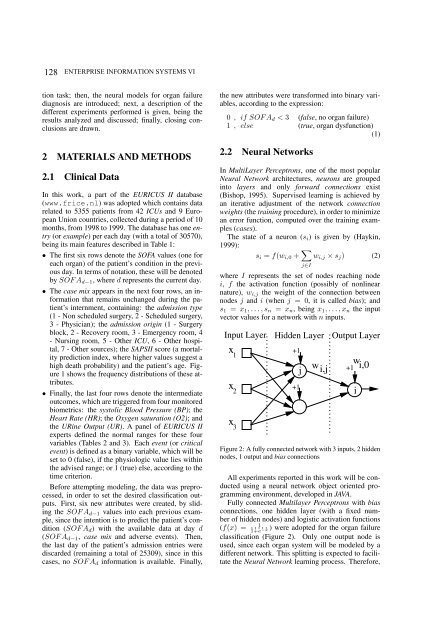
The state of a neuron (si) is given by (Haykin,<br />
1999):<br />
si = f(wi,0 + �<br />
wi,j × sj) (2)<br />
j∈I<br />
where I represents the set of nodes reaching node<br />
i, f the activation function (possibly of nonlinear<br />
nature), wi,j the weight of the connection between<br />
nodes j and i (when j = 0, it is called bias); and<br />
s1 = x1,...,sn = xn, being x1,...,xn the input<br />
vector values for a network with n inputs.<br />
Input Layer Hidden Layer Output Layer<br />
x<br />
1<br />
+1<br />
j<br />
wi,j<br />
w<br />
+1 i,0<br />
x<br />
2<br />
+1<br />
i<br />
x 3<br />
Figure 2: A fully connected network with 3 inputs, 2 hidden<br />
nodes, 1 output and bias connections<br />
All experiments reported in this work will be conducted<br />
using a neural network object oriented programming<br />
environment, developed in JAVA.<br />
Fully connected Multilayer Perceptrons with bias<br />
connections, one hidden layer (with a fixed number<br />
of hidden nodes) and logistic activation functions<br />
1<br />
(f(x) = 1+e−x ) were adopted for the organ failure<br />
classification (Figure 2). Only one output node is<br />
used, since each organ system will be modeled by a<br />
different network. This splitting is expected to facilitate<br />
the Neural Network learning process. Therefore,