Back Room Front Room 2
Back Room Front Room 2
Back Room Front Room 2

Create successful ePaper yourself
Turn your PDF publications into a flip-book with our unique Google optimized e-Paper software.
222 ENTERPRISE INFORMATION SYSTEMS VI<br />
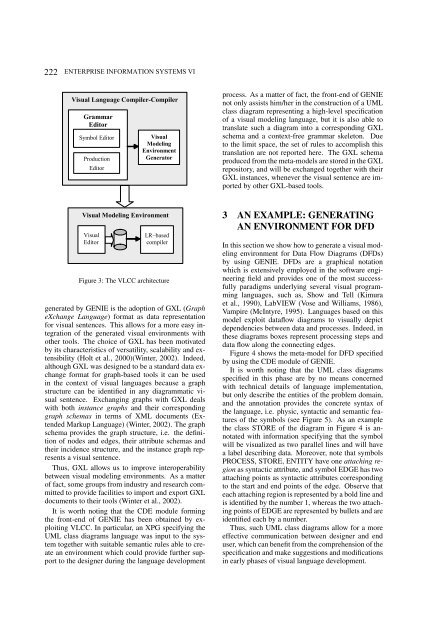
Visual Language Compiler-Compiler<br />
Grammar<br />
Editor<br />
Symbol Editor<br />
Production<br />
Editor<br />
Visual<br />
Modeling<br />
Environment<br />
Generator<br />
Visual Modeling Environment<br />
Visual<br />
Editor<br />
LR–based<br />
compiler<br />
Figure 3: The VLCC architecture<br />
generated by GENIE is the adoption of GXL (Graph<br />
eXchange Language) format as data representation<br />
for visual sentences. This allows for a more easy integration<br />
of the generated visual environments with<br />
other tools. The choice of GXL has been motivated<br />
by its characteristics of versatility, scalability and extensibility<br />
(Holt et al., 2000)(Winter, 2002). Indeed,<br />
although GXL was designed to be a standard data exchange<br />
format for graph-based tools it can be used<br />
in the context of visual languages because a graph<br />
structure can be identified in any diagrammatic visual<br />
sentence. Exchanging graphs with GXL deals<br />
with both instance graphs and their corresponding<br />
graph schemas in terms of XML documents (Extended<br />
Markup Language) (Winter, 2002). The graph<br />
schema provides the graph structure, i.e. the definition<br />
of nodes and edges, their attribute schemas and<br />
their incidence structure, and the instance graph represents<br />
a visual sentence.<br />
Thus, GXL allows us to improve interoperability<br />
between visual modeling environments. As a matter<br />
of fact, some groups from industry and research committed<br />
to provide facilities to import and export GXL<br />
documents to their tools (Winter et al., 2002).<br />
It is worth noting that the CDE module forming<br />
the front-end of GENIE has been obtained by exploiting<br />
VLCC. In particular, an XPG specifying the<br />
UML class diagrams language was input to the system<br />
together with suitable semantic rules able to create<br />
an environment which could provide further support<br />
to the designer during the language development<br />
process. As a matter of fact, the front-end of GENIE<br />
not only assists him/her in the construction of a UML<br />
class diagram representing a high-level specification<br />
of a visual modeling language, but it is also able to<br />
translate such a diagram into a corresponding GXL<br />
schema and a context-free grammar skeleton. Due<br />
to the limit space, the set of rules to accomplish this<br />
translation are not reported here. The GXL schema<br />
produced from the meta-models are stored in the GXL<br />
repository, and will be exchanged together with their<br />
GXL instances, whenever the visual sentence are imported<br />
by other GXL-based tools.<br />
3 AN EXAMPLE: GENERATING<br />
AN ENVIRONMENT FOR DFD<br />
In this section we show how to generate a visual modeling<br />
environment for Data Flow Diagrams (DFDs)<br />
by using GENIE. DFDs are a graphical notation<br />
which is extensively employed in the software engineering<br />
field and provides one of the most successfully<br />
paradigms underlying several visual programming<br />
languages, such as, Show and Tell (Kimura<br />
et al., 1990), LabVIEW (Vose and Williams, 1986),<br />
Vampire (McIntyre, 1995). Languages based on this<br />
model exploit dataflow diagrams to visually depict<br />
dependencies between data and processes. Indeed, in<br />
these diagrams boxes represent processing steps and<br />
data flow along the connecting edges.<br />
Figure 4 shows the meta-model for DFD specified<br />
by using the CDE module of GENIE.<br />
It is worth noting that the UML class diagrams<br />
specified in this phase are by no means concerned<br />
with technical details of language implementation,<br />
but only describe the entities of the problem domain,<br />
and the annotation provides the concrete syntax of<br />
the language, i.e. physic, syntactic and semantic features<br />
of the symbols (see Figure 5). As an example<br />
the class STORE of the diagram in Figure 4 is annotated<br />
with information specifying that the symbol<br />
will be visualized as two parallel lines and will have<br />
a label describing data. Moreover, note that symbols<br />
PROCESS, STORE, ENTITY have one attaching region<br />
as syntactic attribute, and symbol EDGE has two<br />
attaching points as syntactic attributes corresponding<br />
to the start and end points of the edge. Observe that<br />
each attaching region is represented by a bold line and<br />
is identified by the number 1, whereas the two attaching<br />
points of EDGE are represented by bullets and are<br />
identified each by a number.<br />
Thus, such UML class diagrams allow for a more<br />
effective communication between designer and end<br />
user, which can benefit from the comprehension of the<br />
specification and make suggestions and modifications<br />
in early phases of visual language development.