Back Room Front Room 2
Back Room Front Room 2
Back Room Front Room 2
You also want an ePaper? Increase the reach of your titles
YUMPU automatically turns print PDFs into web optimized ePapers that Google loves.
58<br />
ENTERPRISE INFORMATION SYSTEMS VI<br />
�� assess the different task types in a quantitative<br />
way;<br />
�� discover outliers at different granularity levels,<br />
both for monthly observations, and for single<br />
maintenance requests;<br />
�� understand the process in a quantitative way.<br />
To overcome the limitations of the first study<br />
concerning the granularity of the data, the subject<br />
company implemented a specific process<br />
management tool (PMT) and used it in a new<br />
maintenance project. The PMT is web-based and is<br />
used at three different geographical sites,<br />
corresponding to the different Solution Centers<br />
involved in this new project. Its main capabilities are<br />
recording time and effort needed to carry out each<br />
phase of the maintenance process, notifying events<br />
to the maintenance team members responsible to<br />
perform a task when this has to be started,<br />
interfacing existing tools for configuration<br />
management, tracking maintenance requests.<br />
Each maintenance request coming from the customer<br />
is recorded by a fist level Help Desk using a tracking<br />
tool that is on-line consulted only on one site by the<br />
software analysts responsible for this maintenance<br />
project. The analysts have two options: accepting the<br />
request and routing it to other sites or discarding the<br />
request and providing the motivations directly to the<br />
Help Desk tracking tool. Each accepted request is<br />
assigned a typology, that can be Change (small<br />
evolution), Defect (trouble ticket), or Other.<br />
Moreover, if the request is classified as Defect, there<br />
are other attributes specifying the severity and the<br />
associated priority (High, Medium, Low). The<br />
maintenance process is composed of a set of phases<br />
(shown in Table 1), again decomposable in a set of<br />
elementary activities based on the typology of the<br />
maintenance request. Each phase can be assigned to<br />
different human resources allocated on the project.<br />
The new project was still on when we started the<br />
empirical study, so the data concerning the first 6<br />
months of the project were available. The PMT<br />
allowed to collect about 30,000 observations,<br />
concerning 7,310 maintenance requests received in<br />
these 6 months. In this case, each observation<br />
corresponds to one phase of the maintenance process<br />
applied to a maintenance request, while in the<br />
previous empirical study it corresponded to the<br />
aggregation of all the maintenance requests received<br />
in one month. For each maintenance request the<br />
following data was available:<br />
�� Effort spent on each phase of the maintenance<br />
process (measured in man-hours);<br />
�� Priority, split in three categories:<br />
High: anomalies that entail the total<br />
unavailability of the system;<br />
Medium: anomalies that entail the partial<br />
unavailability (one or more functions) of the<br />
system;<br />
Low: anomalies that do not entail blocks of the<br />
system’s functions, but degrade the<br />
performances of the system or cause incorrect<br />
operations or are limited to the user interface.<br />
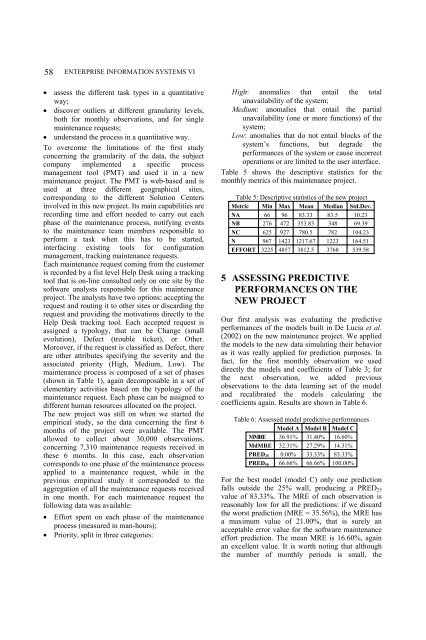
Table 5 shows the descriptive statistics for the<br />
monthly metrics of this maintenance project.<br />
Table 5: Descriptive statistics of the new project<br />
Metric Min Max Mean Median Std.Dev.<br />
NA 66 96 83.33 83.5 10.23<br />
NB 276 472 353.83 348 69.39<br />
NC 625 927 780.5 782 104.23<br />
N 967 1423 1217.67 1223 164.51<br />
EFFORT 3225 4857 3812.5 3768 539.58<br />
5 ASSESSING PREDICTIVE<br />
PERFORMANCES ON THE<br />
NEW PROJECT<br />
Our first analysis was evaluating the predictive<br />
performances of the models built in De Lucia et al.<br />
(2002) on the new maintenance project. We applied<br />
the models to the new data simulating their behavior<br />
as it was really applied for prediction purposes. In<br />
fact, for the first monthly observation we used<br />
directly the models and coefficients of Table 3; for<br />
the next observation, we added previous<br />
observations to the data learning set of the model<br />
and recalibrated the models calculating the<br />
coefficients again. Results are shown in Table 6.<br />
Table 6: Assessed model predictive performances<br />
Model A Model B Model C<br />
MMRE 36.91% 31.40% 16.60%<br />
MdMRE 32.31% 27.29% 14.31%<br />
PRED25 0.00% 33.33% 83.33%<br />
PRED50 66.66% 66.66% 100.00%<br />
For the best model (model C) only one prediction<br />
falls outside the 25% wall, producing a PRED25<br />
value of 83.33%. The MRE of each observation is<br />
reasonably low for all the predictions: if we discard<br />
the worst prediction (MRE = 35.56%), the MRE has<br />
a maximum value of 21.00%, that is surely an<br />
acceptable error value for the software maintenance<br />
effort prediction. The mean MRE is 16.60%, again<br />
an excellent value. It is worth noting that although<br />
the number of monthly periods is small, the


