Back Room Front Room 2
Back Room Front Room 2
Back Room Front Room 2

Create successful ePaper yourself
Turn your PDF publications into a flip-book with our unique Google optimized e-Paper software.
60<br />
ENTERPRISE INFORMATION SYSTEMS VI<br />
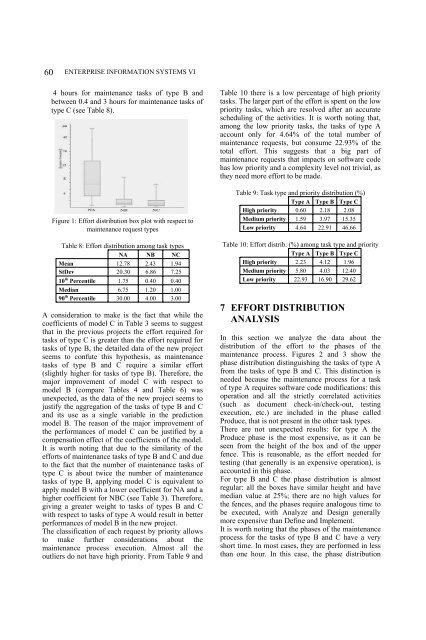
4 hours for maintenance tasks of type B and<br />
between 0.4 and 3 hours for maintenance tasks of<br />
type C (see Table 8).<br />
Figure 1: Effort distribution box plot with respect to<br />
maintenance request types<br />
Table 8: Effort distribution among task types<br />
NA NB NC<br />
Mean 12.78 2.43 1.94<br />
StDev 20.30 6.86 7.25<br />
10 th Percentile 1.75 0.40 0.40<br />
Median 6.75 1.20 1.00<br />
90 th Percentile 30.00 4.00 3.00<br />
A consideration to make is the fact that while the<br />
coefficients of model C in Table 3 seems to suggest<br />
that in the previous projects the effort required for<br />
tasks of type C is greater than the effort required for<br />
tasks of type B, the detailed data of the new project<br />
seems to confute this hypothesis, as maintenance<br />
tasks of type B and C require a similar effort<br />
(slightly higher for tasks of type B). Therefore, the<br />
major improvement of model C with respect to<br />
model B (compare Tables 4 and Table 6) was<br />
unexpected, as the data of the new project seems to<br />
justify the aggregation of the tasks of type B and C<br />
and its use as a single variable in the prediction<br />
model B. The reason of the major improvement of<br />
the performances of model C can be justified by a<br />
compensation effect of the coefficients of the model.<br />
It is worth noting that due to the similarity of the<br />
efforts of maintenance tasks of type B and C and due<br />
to the fact that the number of maintenance tasks of<br />
type C is about twice the number of maintenance<br />
tasks of type B, applying model C is equivalent to<br />
apply model B with a lower coefficient for NA and a<br />
higher coefficient for NBC (see Table 3). Therefore,<br />
giving a greater weight to tasks of types B and C<br />
with respect to tasks of type A would result in better<br />
performances of model B in the new project.<br />
The classification of each request by priority allows<br />
to make further considerations about the<br />
maintenance process execution. Almost all the<br />
outliers do not have high priority. From Table 9 and<br />
Table 10 there is a low percentage of high priority<br />
tasks. The larger part of the effort is spent on the low<br />
priority tasks, which are resolved after an accurate<br />
scheduling of the activities. It is worth noting that,<br />
among the low priority tasks, the tasks of type A<br />
account only for 4.64% of the total number of<br />
maintenance requests, but consume 22.93% of the<br />
total effort. This suggests that a big part of<br />
maintenance requests that impacts on software code<br />
has low priority and a complexity level not trivial, as<br />
they need more effort to be made.<br />
Table 9: Task type and priority distribution (%)<br />
Type A Type B Type C<br />
High priority 0.60 2.18 2.08<br />
Medium priority 1.59 3.97 15.35<br />
Low priority 4.64 22.91 46.66<br />
Table 10: Effort distrib. (%) among task type and priority<br />
Type A Type B Type C<br />
High priority 2.23 4.12 1.96<br />
Medium priority 5.80 4.03 12.40<br />
Low priority 22.93 16.90 29.62<br />
7 EFFORT DISTRIBUTION<br />
ANALYSIS<br />
In this section we analyze the data about the<br />
distribution of the effort to the phases of the<br />
maintenance process. Figures 2 and 3 show the<br />
phase distribution distinguishing the tasks of type A<br />
from the tasks of type B and C. This distinction is<br />
needed because the maintenance process for a task<br />
of type A requires software code modifications: this<br />
operation and all the strictly correlated activities<br />
(such as document check-in/check-out, testing<br />
execution, etc.) are included in the phase called<br />
Produce, that is not present in the other task types.<br />
There are not unexpected results: for type A the<br />
Produce phase is the most expensive, as it can be<br />
seen from the height of the box and of the upper<br />
fence. This is reasonable, as the effort needed for<br />
testing (that generally is an expensive operation), is<br />
accounted in this phase.<br />
For type B and C the phase distribution is almost<br />
regular: all the boxes have similar height and have<br />
median value at 25%; there are no high values for<br />
the fences, and the phases require analogous time to<br />
be executed, with Analyze and Design generally<br />
more expensive than Define and Implement.<br />
It is worth noting that the phases of the maintenance<br />
process for the tasks of type B and C have a very<br />
short time. In most cases, they are performed in less<br />
than one hour. In this case, the phase distribution