Back Room Front Room 2
Back Room Front Room 2
Back Room Front Room 2

Create successful ePaper yourself
Turn your PDF publications into a flip-book with our unique Google optimized e-Paper software.
An example of high-level goal was expressed<br />
with respect to the overall presence of spectators in<br />
a venue. Given that a venue may hold more than<br />
one event during a day, at any time there may be<br />
spectators arriving at the venue area for one of the<br />
upcoming sessions, spectators leaving the venue<br />
from one of the past sessions, and spectators<br />
participating in a current session. The total number<br />
of spectators present has to be somehow controlled<br />
for practical reasons such as the availability of<br />
resources (e.g. space), but also due to safety<br />
concerns. This translates into the goal ‘manage the<br />
total presence of spectators in the venue area’. This<br />
is an abstract goal that needs to be made more<br />
specific; to refine it, the stakeholders examined the<br />
factors influencing the presence of spectators in the<br />
venue and their distribution in the various areas of<br />
which it consists.<br />
In order to understand the effects of choices that<br />
stakeholders made, it was essential to develop<br />
business process models that operationalised the<br />
stakeholders’ goals. These models could be viewed<br />
at both a ‘local’ level and a ‘global’ level. Local<br />
level process view related to a single customer<br />
group, a small area of the venue, and a small part of<br />
venue resources and functions (workforce,<br />
machinery, consumables). Global level process view<br />
corresponded to the dynamic profiling of all venue<br />
components, over an extended time frame (e.g. an<br />
entire day of the Games), possibly with respect to<br />
the needs of more than one customer group.<br />
A distinguishing feature of this type of situation<br />
is the large number of different service types that the<br />
model must represent, since the behaviour of the<br />
venue operations system is affected by each of these<br />
service sub-components. As a result, the degree of<br />
complexity in the resulting process model rises<br />
dramatically.<br />
ENGAGING STAKEHOLDERS IN DEFINING EARLY REQUIREMENTS 39<br />
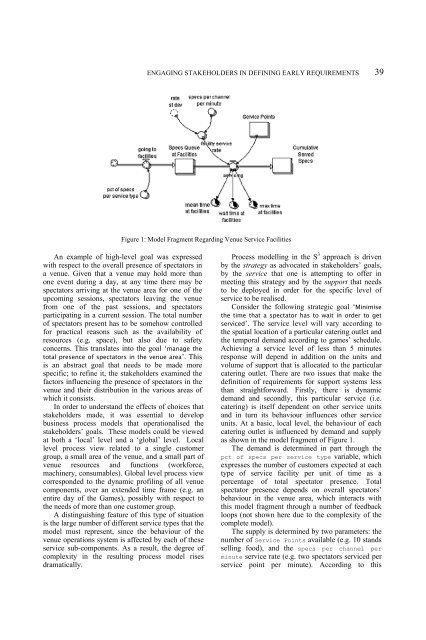
Figure 1: Model Fragment Regarding Venue Service Facilities<br />
Process modelling in the S 3 approach is driven<br />
by the strategy as advocated in stakeholders’ goals,<br />
by the service that one is attempting to offer in<br />
meeting this strategy and by the support that needs<br />
to be deployed in order for the specific level of<br />
service to be realised.<br />
Consider the following strategic goal ‘Minimise<br />
the time that a spectator has to wait in order to get<br />
serviced’. The service level will vary according to<br />
the spatial location of a particular catering outlet and<br />
the temporal demand according to games’ schedule.<br />
Achieving a service level of less than 5 minutes<br />
response will depend in addition on the units and<br />
volume of support that is allocated to the particular<br />
catering outlet. There are two issues that make the<br />
definition of requirements for support systems less<br />
than straightforward. Firstly, there is dynamic<br />
demand and secondly, this particular service (i.e.<br />
catering) is itself dependent on other service units<br />
and in turn its behaviour influences other service<br />
units. At a basic, local level, the behaviour of each<br />
catering outlet is influenced by demand and supply<br />
as shown in the model fragment of Figure 1.<br />
The demand is determined in part through the<br />
pct of specs per service type variable, which<br />
expresses the number of customers expected at each<br />
type of service facility per unit of time as a<br />
percentage of total spectator presence. Total<br />
spectator presence depends on overall spectators’<br />
behaviour in the venue area, which interacts with<br />
this model fragment through a number of feedback<br />
loops (not shown here due to the complexity of the<br />
complete model).<br />
The supply is determined by two parameters: the<br />
number of Service Points available (e.g. 10 stands<br />
selling food), and the specs per channel per<br />
minute service rate (e.g. two spectators serviced per<br />
service point per minute). According to this