Back Room Front Room 2
Back Room Front Room 2
Back Room Front Room 2

You also want an ePaper? Increase the reach of your titles
YUMPU automatically turns print PDFs into web optimized ePapers that Google loves.
78<br />
5.3.4 The Effect of Having Different Cache<br />
Sizes<br />
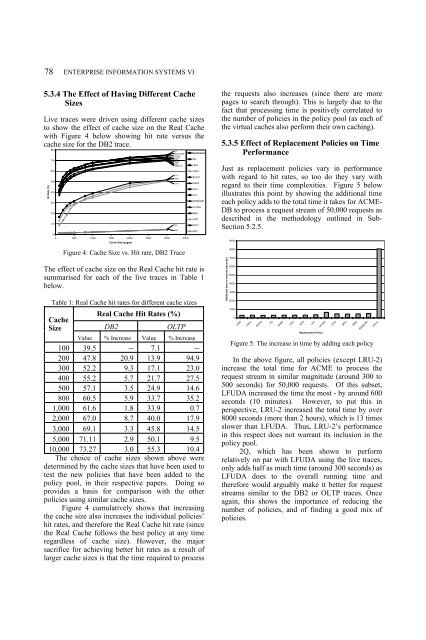
Live traces were driven using different cache sizes<br />
to show the effect of cache size on the Real Cache<br />
with Figure 4 below showing hit rate versus the<br />
cache size for the DB2 trace.<br />
Hit Rate (%)<br />
ENTERPRISE INFORMATION SYSTEMS VI<br />
80<br />
2Q<br />
Real Cache<br />
LFUDA<br />
RealCache<br />
WWR<br />
70<br />
LRU<br />
SFIFO<br />
LIRS<br />
2Q<br />
FIFO<br />
RANDOM LIRS<br />
60<br />
LRFU<br />
LFU<br />
LRFU<br />
SFIFO<br />
50<br />
40<br />
LIFO<br />
WWR<br />
LRU<br />
LFU<br />
30<br />
RANDOM<br />
LFUDA<br />
20<br />
MRU<br />
LIFO<br />
10<br />
MFU<br />
FIFO<br />
0<br />
MRU<br />
MFU<br />
0 500 1000 1500 2000 2500 3000 3500<br />
Cache Size (pages)<br />
Figure 4: Cache Size vs. Hit rate, DB2 Trace<br />
The effect of cache size on the Real Cache hit rate is<br />
summarised for each of the live traces in Table 1<br />
below.<br />
Table 1: Real Cache hit rates for different cache sizes<br />
Cache<br />
Size<br />
Real Cache Hit Rates (%)<br />
DB2 OLTP<br />
Value % Increase Value % Increase<br />
100 39.5 -- 7.1 --<br />
200 47.8 20.9 13.9 94.9<br />
300 52.2 9.3 17.1 23.0<br />
400 55.2 5.7 21.7 27.5<br />
500 57.1 3.5 24.9 14.6<br />
800 60.5 5.9 33.7 35.2<br />
1,000 61.6 1.8 33.9 0.7<br />
2,000 67.0 8.7 40.0 17.9<br />
3,000 69.1 3.3 45.8 14.5<br />
5,000 71.11 2.9 50.1 9.5<br />
10,000 73.27 3.0 55.3 10.4<br />
The choice of cache sizes shown above were<br />
determined by the cache sizes that have been used to<br />
test the new policies that have been added to the<br />
policy pool, in their respective papers. Doing so<br />
provides a basis for comparison with the other<br />
policies using similar cache sizes.<br />
Figure 4 cumulatively shows that increasing<br />
the cache size also increases the individual policies’<br />
hit rates, and therefore the Real Cache hit rate (since<br />
the Real Cache follows the best policy at any time<br />
regardless of cache size). However, the major<br />
sacrifice for achieving better hit rates as a result of<br />
larger cache sizes is that the time required to process<br />
the requests also increases (since there are more<br />
pages to search through). This is largely due to the<br />
fact that processing time is positively correlated to<br />
the number of policies in the policy pool (as each of<br />
the virtual caches also perform their own caching).<br />
5.3.5 Effect of Replacement Policies on Time<br />
Performance<br />
Just as replacement policies vary in performance<br />
with regard to hit rates, so too do they vary with<br />
regard to their time complexities. Figure 5 below<br />
illustrates this point by showing the additional time<br />
each policy adds to the total time it takes for ACME-<br />
DB to process a request stream of 50,000 requests as<br />
described in the methodology outlined in Sub-<br />
Section 5.2.5.<br />
Additional time to execute (seconds)<br />
9000<br />
8000<br />
7000<br />
6000<br />
5000<br />
4000<br />
3000<br />
2000<br />
1000<br />
0<br />
LIRS<br />
LRFU<br />
SFIFO<br />
2Q<br />
WWR<br />
LRU<br />
FIFO<br />
LFU<br />
LFUDA<br />
LIFO<br />
MFU<br />
MRU<br />
RANDOM<br />
LRU-2<br />
Replacement Policy<br />
Figure 5: The increase in time by adding each policy<br />
In the above figure, all policies (except LRU-2)<br />
increase the total time for ACME to process the<br />
request stream in similar magnitude (around 300 to<br />
500 seconds) for 50,000 requests. Of this subset,<br />
LFUDA increased the time the most - by around 600<br />
seconds (10 minutes). However, to put this in<br />
perspective, LRU-2 increased the total time by over<br />
8000 seconds (more than 2 hours), which is 13 times<br />
slower than LFUDA. Thus, LRU-2’s performance<br />
in this respect does not warrant its inclusion in the<br />
policy pool.<br />
2Q, which has been shown to perform<br />
relatively on par with LFUDA using the live traces,<br />
only adds half as much time (around 300 seconds) as<br />
LFUDA does to the overall running time and<br />
therefore would arguably make it better for request<br />
streams similar to the DB2 or OLTP traces. Once<br />
again, this shows the importance of reducing the<br />
number of policies, and of finding a good mix of<br />
policies.