Back Room Front Room 2
Back Room Front Room 2
Back Room Front Room 2

Create successful ePaper yourself
Turn your PDF publications into a flip-book with our unique Google optimized e-Paper software.
MINING THE RELATIONSHIPS IN THE FORM OF THE PREDISPOSING FACTORS<br />
the number of Download significantly increases are<br />
the same as its predisposing factors but after that the<br />
number of all of the other attributes decreases.<br />
7.1.2 Slope Direction of the Download is<br />
Negative<br />
Table 3: Summary of the result in case the slope direction<br />
of the Download is negative<br />
previous current post<br />
P/V up down down<br />
Bugs0 up down down<br />
Bugs1 up down up<br />
Support0 up down down<br />
Support1 up down up<br />
Patches0 up down up<br />
Patches1 up down up<br />
Tracker0 up down down<br />
Tracker1 up down up<br />
Tasks0 down down down<br />
Tasks1 down down down<br />
CVS down down down<br />
From these results, we find that the predisposing<br />
factors of the number of the Download significantly<br />
decreases are the number of almost all of the other<br />
attributes increases, except only the number of<br />
Tasks0, Tasks1 and CVS decrease. And the coincident<br />
factors of the number of Download<br />
significantly decrease are the number of all of the<br />
other attributes decrease at the same time interval.<br />
After that the number P/V, Bugs0, Support0,<br />
Tracker0, Tasks0, Tasks1, CVS decrease and the<br />
number of Bugs1, Support1, Patches0, Patches1,<br />
Tracker1 increase .<br />
8 PERFORMANCE<br />
Our methods consume time to find the predisposing<br />
factor and the co-incident factor of the reference<br />
event just in O(n) where n is the number of the total<br />
records. The most time consuming is the time for<br />
calculating the slope (the data change) of every two<br />
adjacent time points of the same project which take<br />
time O(n). And we have to spend time to select the<br />
reference event by using the threshold which takes<br />
time O(n). We have to spend time to group records<br />
around the reference event (at the previous time<br />
point, the current time point and the post time point)<br />
which is O(n). And the time for counting the number<br />
of events of the other attributes at each time point<br />
around the current time point is O(n). The time in<br />
overall process can be approximate to O(n), which is<br />
not exponential. So our methods are good enough to<br />
apply in the big real life data set.<br />
In our experiments we use PC PentiumIV 1.6<br />
GHz, RAM 1 GB. The operating system is MS<br />
WindowsXP Professional. We implement these<br />
algorithms in Perl 5.8 on command line. The data set<br />
test has 1,097,341 records, 41, 540 projects with total<br />
17 attributes. The number of attributes of<br />
consideration is 13 attributes. The size of this data set<br />
is about 48 MB.<br />
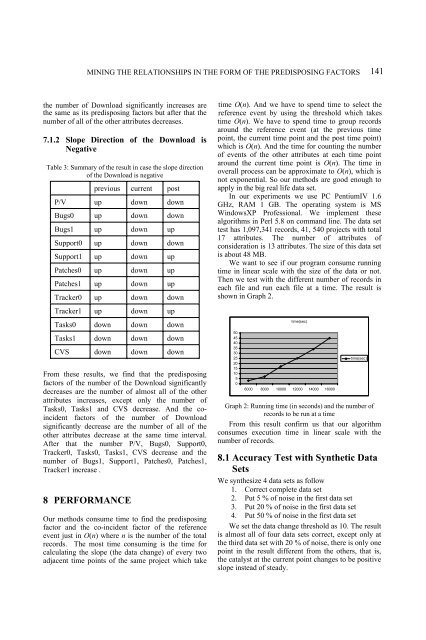
We want to see if our program consume running<br />
time in linear scale with the size of the data or not.<br />
Then we test with the different number of records in<br />
each file and run each file at a time. The result is<br />
shown in Graph 2.<br />
50<br />
45<br />
40<br />
35<br />
30<br />
25<br />
20<br />
15<br />
10<br />
5<br />
0<br />
time(sec)<br />
6000 8000 10000 12000 14000 16000<br />
time(sec)<br />
141<br />
Graph 2: Running time (in seconds) and the number of<br />
records to be run at a time<br />
From this result confirm us that our algorithm<br />
consumes execution time in linear scale with the<br />
number of records.<br />
8.1 Accuracy Test with Synthetic Data<br />
Sets<br />
We synthesize 4 data sets as follow<br />
1. Correct complete data set<br />
2. Put 5 % of noise in the first data set<br />
3. Put 20 % of noise in the first data set<br />
4. Put 50 % of noise in the first data set<br />
We set the data change threshold as 10. The result<br />
is almost all of four data sets correct, except only at<br />
the third data set with 20 % of noise, there is only one<br />
point in the result different from the others, that is,<br />
the catalyst at the current point changes to be positive<br />
slope instead of steady.