Back Room Front Room 2
Back Room Front Room 2
Back Room Front Room 2

You also want an ePaper? Increase the reach of your titles
YUMPU automatically turns print PDFs into web optimized ePapers that Google loves.
40<br />
ENTERPRISE INFORMATION SYSTEMS VI<br />
representation, spectators arrive at the service<br />
facility (going to facilities), queue there for a<br />
while if no service point is available (Specs Queue<br />
at Facilities), and eventually get serviced<br />
(servicing).<br />
Using this model fragment we can elaborate on<br />
the way that stakeholder goals were refined through<br />
the use of process modelling. We previously<br />
mentioned the high-level goal ‘Minimise the time<br />
that a customer has to wait in order to get serviced’.<br />
The realisation of this goal for a given type of<br />
service facility, and for a given demand, depends on<br />
the availability of supply for that facility. Supply is<br />
composed of two independent factors, the number of<br />
service points and the service rate. Therefore, the<br />
initial goal was decomposed into two<br />
complementary (i.e. non-competing) goals:<br />
‘Maximise the number of service points’ and<br />
‘maximise the service rate’. These goals are more<br />
accurate than the initial one, however they need to<br />
be analysed further in order to become quantifiable.<br />
2.2 Scenarios<br />
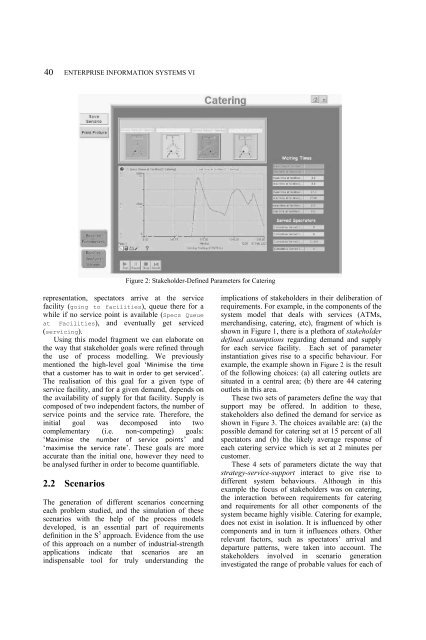
Figure 2: Stakeholder-Defined Parameters for Catering<br />
The generation of different scenarios concerning<br />
each problem studied, and the simulation of these<br />
scenarios with the help of the process models<br />
developed, is an essential part of requirements<br />
definition in the S 3 approach. Evidence from the use<br />
of this approach on a number of industrial-strength<br />
applications indicate that scenarios are an<br />
indispensable tool for truly understanding the<br />
implications of stakeholders in their deliberation of<br />
requirements. For example, in the components of the<br />
system model that deals with services (ATMs,<br />
merchandising, catering, etc), fragment of which is<br />
shown in Figure 1, there is a plethora of stakeholder<br />
defined assumptions regarding demand and supply<br />
for each service facility. Each set of parameter<br />
instantiation gives rise to a specific behaviour. For<br />
example, the example shown in Figure 2 is the result<br />
of the following choices: (a) all catering outlets are<br />
situated in a central area; (b) there are 44 catering<br />
outlets in this area.<br />
These two sets of parameters define the way that<br />
support may be offered. In addition to these,<br />
stakeholders also defined the demand for service as<br />
shown in Figure 3. The choices available are: (a) the<br />
possible demand for catering set at 15 percent of all<br />
spectators and (b) the likely average response of<br />
each catering service which is set at 2 minutes per<br />
customer.<br />
These 4 sets of parameters dictate the way that<br />
strategy-service-support interact to give rise to<br />
different system behaviours. Although in this<br />
example the focus of stakeholders was on catering,<br />
the interaction between requirements for catering<br />
and requirements for all other components of the<br />
system became highly visible. Catering for example,<br />
does not exist in isolation. It is influenced by other<br />
components and in turn it influences others. Other<br />
relevant factors, such as spectators’ arrival and<br />
departure patterns, were taken into account. The<br />
stakeholders involved in scenario generation<br />
investigated the range of probable values for each of