Challenger TAFE | Annual Report 2006 - Parliament of Western ...
Challenger TAFE | Annual Report 2006 - Parliament of Western ...
Challenger TAFE | Annual Report 2006 - Parliament of Western ...

You also want an ePaper? Increase the reach of your titles
YUMPU automatically turns print PDFs into web optimized ePapers that Google loves.
<strong>Challenger</strong> <strong>TAFE</strong> | <strong>Annual</strong> <strong>Report</strong> <strong>2006</strong> 39<br />
PERFORMANCE INDICATORS FOR EFFECTIVENESS STUDENT SATISFACTION SURVEY – DATA BASED ON THE STATE<br />
SURVEY OF ENROLLED STUDENTS<br />
A survey managed by the <strong>Western</strong> Australian Department <strong>of</strong> Education and Training during the <strong>2006</strong> academic year measured<br />
student satisfaction at College and State levels and provides an indicator <strong>of</strong> the effectiveness <strong>of</strong> <strong>Challenger</strong> <strong>TAFE</strong>’s training<br />
services and products. The survey asked students about their degree <strong>of</strong> satisfaction with the quality and relevance <strong>of</strong> their<br />
courses and the teaching, student support, learning resources and facilities provided.<br />
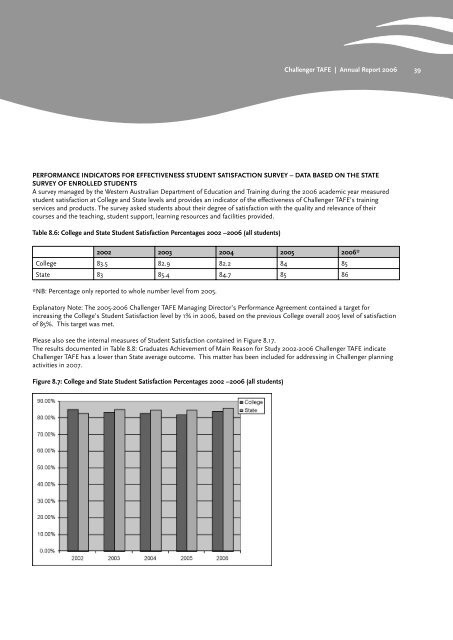
Table 8.6: College and State Student Satisfaction Percentages 2002 –<strong>2006</strong> (all students)<br />
2002 2003 2004 2005 <strong>2006</strong>*<br />
College 83.5 82.9 82.2 84 85<br />
State 83 85.4 84.7 85 86<br />
*NB: Percentage only reported to whole number level from 2005.<br />
Explanatory Note: The 2005-<strong>2006</strong> <strong>Challenger</strong> <strong>TAFE</strong> Managing Director’s Performance Agreement contained a target for<br />
increasing the College’s Student Satisfaction level by 1% in <strong>2006</strong>, based on the previous College overall 2005 level <strong>of</strong> satisfaction<br />
<strong>of</strong> 85%. This target was met.<br />
Please also see the internal measures <strong>of</strong> Student Satisfaction contained in Figure 8.17.<br />
The results documented in Table 8.8: Graduates Achievement <strong>of</strong> Main Reason for Study 2002-<strong>2006</strong> <strong>Challenger</strong> <strong>TAFE</strong> indicate<br />
<strong>Challenger</strong> <strong>TAFE</strong> has a lower than State average outcome. This matter has been included for addressing in <strong>Challenger</strong> planning<br />
activities in 2007.<br />
Figure 8.7: College and State Student Satisfaction Percentages 2002 –<strong>2006</strong> (all students)