equity implications of health sector user fees in tanzania
equity implications of health sector user fees in tanzania
equity implications of health sector user fees in tanzania

You also want an ePaper? Increase the reach of your titles
YUMPU automatically turns print PDFs into web optimized ePapers that Google loves.
eported <strong>in</strong>come proportion for the <strong>health</strong> <strong>sector</strong> was 10.5% but variations were reported between 1%<br />
and 22%. The average <strong>in</strong>come per capita from cost shar<strong>in</strong>g across the Councils was Tshs. 105/=<br />
vary<strong>in</strong>g between Tshs. 5/= per capita <strong>in</strong> Muf<strong>in</strong>di Council and Tshs.305/= per capita <strong>in</strong> Muheza Council.<br />
Three Councils reported the proportion <strong>of</strong> the overall funds for <strong>health</strong> collected through the CHF. This<br />
was respectively 2%, 5% and 13% with an average <strong>of</strong> Tshs. 53/= per capita collected <strong>in</strong> 2000. There<br />
was no <strong>in</strong>formation available on how the <strong>in</strong>come from cost shar<strong>in</strong>g and CHF was re-distributed by the<br />
Council to PHC facilities or priority areas. The vast majority <strong>of</strong> the overall <strong>health</strong> funds were allocated<br />
towards recurrent costs. Personnel Emoluments, Drugs and Medical Supplies consumed 82% <strong>of</strong> total<br />
expenditures.<br />
Contribution <strong>of</strong> <strong>user</strong> <strong>fees</strong> to the resource envelope at national level<br />
The MOH/SDC PER Update 2001 analysed the locally generated funds and was able to make a<br />
dist<strong>in</strong>ction between data available on the Community Health Funds operat<strong>in</strong>g <strong>in</strong> primary <strong>health</strong> centres<br />
and the cost shar<strong>in</strong>g Health Services Fund (HSF) operat<strong>in</strong>g <strong>in</strong> hospitals. Data for the years FY02 to<br />
FY04 were projected data. At that time, it was expected that the revenue ga<strong>in</strong>ed from these sources<br />
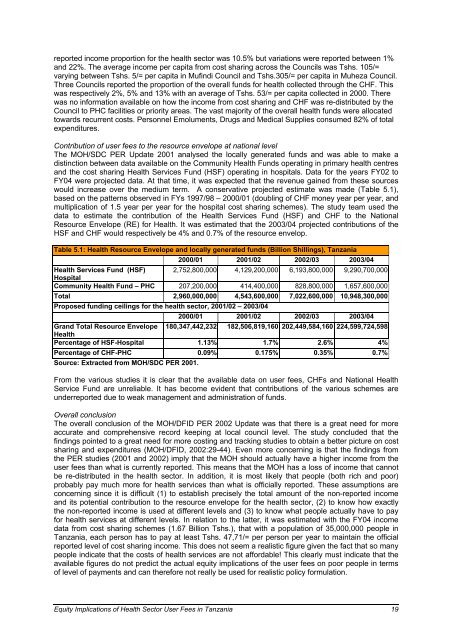
would <strong>in</strong>crease over the medium term. A conservative projected estimate was made (Table 5.1),<br />
based on the patterns observed <strong>in</strong> FYs 1997/98 – 2000/01 (doubl<strong>in</strong>g <strong>of</strong> CHF money year per year, and<br />
multiplication <strong>of</strong> 1.5 year per year for the hospital cost shar<strong>in</strong>g schemes). The study team used the<br />
data to estimate the contribution <strong>of</strong> the Health Services Fund (HSF) and CHF to the National<br />
Resource Envelope (RE) for Health. It was estimated that the 2003/04 projected contributions <strong>of</strong> the<br />
HSF and CHF would respectively be 4% and 0.7% <strong>of</strong> the resource envelop.<br />
Table 5.1: Health Resource Envelope and locally generated funds (Billion Shill<strong>in</strong>gs), Tanzania<br />
2000/01 2001/02 2002/03 2003/04<br />
Health Services Fund (HSF)<br />
Hospital<br />
2,752,800,000 4,129,200,000 6,193,800,000 9,290,700,000<br />
Community Health Fund – PHC 207,200,000 414,400,000 828,800,000 1,657,600,000<br />
Total 2,960,000,000 4,543,600,000 7,022,600,000 10,948,300,000<br />
Proposed fund<strong>in</strong>g ceil<strong>in</strong>gs for the <strong>health</strong> <strong>sector</strong>, 2001/02 – 2003/04<br />
2000/01 2001/02 2002/03 2003/04<br />
Grand Total Resource Envelope<br />
Health<br />
180,347,442,232 182,506,819,160 202,449,584,160 224,599,724,598<br />
Percentage <strong>of</strong> HSF-Hospital 1.13% 1.7% 2.6% 4%<br />
Percentage <strong>of</strong> CHF-PHC 0.09% 0.175% 0.35% 0.7%<br />
Source: Extracted from MOH/SDC PER 2001.<br />
From the various studies it is clear that the available data on <strong>user</strong> <strong>fees</strong>, CHFs and National Health<br />
Service Fund are unreliable. It has become evident that contributions <strong>of</strong> the various schemes are<br />
underreported due to weak management and adm<strong>in</strong>istration <strong>of</strong> funds.<br />
Overall conclusion<br />
The overall conclusion <strong>of</strong> the MOH/DFID PER 2002 Update was that there is a great need for more<br />
accurate and comprehensive record keep<strong>in</strong>g at local council level. The study concluded that the<br />
f<strong>in</strong>d<strong>in</strong>gs po<strong>in</strong>ted to a great need for more cost<strong>in</strong>g and track<strong>in</strong>g studies to obta<strong>in</strong> a better picture on cost<br />
shar<strong>in</strong>g and expenditures (MOH/DFID, 2002:29-44). Even more concern<strong>in</strong>g is that the f<strong>in</strong>d<strong>in</strong>gs from<br />
the PER studies (2001 and 2002) imply that the MOH should actually have a higher <strong>in</strong>come from the<br />
<strong>user</strong> <strong>fees</strong> than what is currently reported. This means that the MOH has a loss <strong>of</strong> <strong>in</strong>come that cannot<br />
be re-distributed <strong>in</strong> the <strong>health</strong> <strong>sector</strong>. In addition, it is most likely that people (both rich and poor)<br />
probably pay much more for <strong>health</strong> services than what is <strong>of</strong>ficially reported. These assumptions are<br />
concern<strong>in</strong>g s<strong>in</strong>ce it is difficult (1) to establish precisely the total amount <strong>of</strong> the non-reported <strong>in</strong>come<br />
and its potential contribution to the resource envelope for the <strong>health</strong> <strong>sector</strong>, (2) to know how exactly<br />
the non-reported <strong>in</strong>come is used at different levels and (3) to know what people actually have to pay<br />
for <strong>health</strong> services at different levels. In relation to the latter, it was estimated with the FY04 <strong>in</strong>come<br />
data from cost shar<strong>in</strong>g schemes (1.67 Billion Tshs.), that with a population <strong>of</strong> 35,000,000 people <strong>in</strong><br />
Tanzania, each person has to pay at least Tshs. 47,71/= per person per year to ma<strong>in</strong>ta<strong>in</strong> the <strong>of</strong>ficial<br />
reported level <strong>of</strong> cost shar<strong>in</strong>g <strong>in</strong>come. This does not seem a realistic figure given the fact that so many<br />
people <strong>in</strong>dicate that the costs <strong>of</strong> <strong>health</strong> services are not affordable! This clearly must <strong>in</strong>dicate that the<br />
available figures do not predict the actual <strong>equity</strong> <strong>implications</strong> <strong>of</strong> the <strong>user</strong> <strong>fees</strong> on poor people <strong>in</strong> terms<br />
<strong>of</strong> level <strong>of</strong> payments and can therefore not really be used for realistic policy formulation.<br />
Equity Implications <strong>of</strong> Health Sector User Fees <strong>in</strong> Tanzania 19