

Annual Report 2010 - AdP
Annual Report 2010 - AdP
Annual Report 2010 - AdP

Create successful ePaper yourself
Turn your PDF publications into a flip-book with our unique Google optimized e-Paper software.
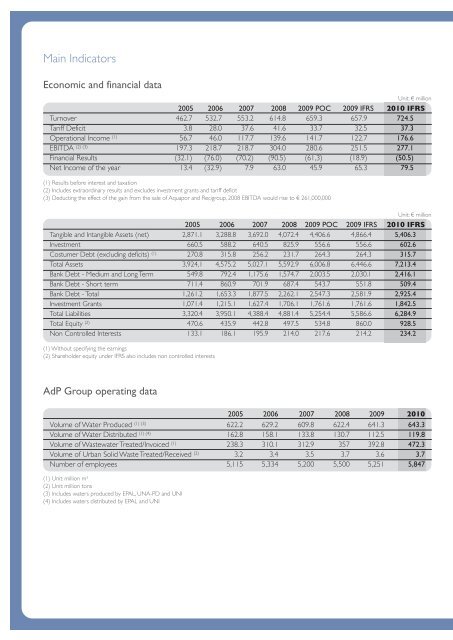
Economic and financial data<br />
2005 2006 2007 2008 2009 POC 2009 IFRS <strong>2010</strong> IFRS<br />
Turnover 462.7 532.7 553.2 614.8 659.3 657.9 724.5<br />
Tariff Deficit 3.8 28.0 37.6 41.6 33.7 32.5 37.3<br />
Operational Income (1) 56.7 46.0 117.7 139.6 141.7 122.7 176.6<br />
EBITDA (2) (3) Unit: € million<br />
197.3 218.7 218.7 304.0 280.6 251.5 277.1<br />
Financial Results (32.1) (76.0) (70.2) (90.5) (61,3) (18.9) (50.5)<br />
Net Income of the year 13.4 (32.9) 7.9 63.0 45.9 65.3 79.5<br />
(1) Results before interest and taxation<br />
(2) Includes extraordinary results and excludes investment grants and tariff deficit<br />
(3) Deducting the effect of the gain from the sale of Aquapor and Recigroup, 2008 EBITDA would rise to € 261,000,000<br />
2005 2006 2007 2008 2009 POC 2009 IFRS <strong>2010</strong> IFRS<br />
Tangible and Intangible Assets (net) 2,871.1 3,288.8 3,692.0 4,072.4 4,406.6 4,866.4 5,406.3<br />
Investment 660.5 588.2 640.5 825.9 556.6 556.6 602.6<br />
Costumer Debt (excluding deficits) (1) 270.8 315.8 256.2 231.7 264.3 264.3 315.7<br />
Total Assets 3,924,1 4,575.2 5,027.1 5,592.9 6,006.8 6,446.6 7,213.4<br />
Bank Debt - Medium and Long Term 549.8 792.4 1,175.6 1,574.7 2,003.5 2,030.1 2,416.1<br />
Bank Debt - Short term 711.4 860.9 701.9 687.4 543.7 551.8 509.4<br />
Bank Debt - Total 1,261.2 1,653.3 1,877.5 2,262.1 2,547.3 2,581.9 2,925.4<br />
Investment Grants 1,071.4 1,215.1 1,627.4 1,706.1 1,761.6 1,761.6 1,842.5<br />
Total Liabilities 3,320.4 3,950.1 4,388.4 4,881.4 5,254.4 5,586.6 6,284.9<br />
Total Equity (2) Unit: € million<br />
470.6 435.9 442.8 497.5 534.8 860.0 928.5<br />
Non Controlled Interests 133.1 186.1 195.9 214.0 217.6 214.2 234.2<br />
(1) Without specifying the earnings<br />
(2) Shareholder equity under IFRS also includes non controlled interests<br />
<strong>AdP</strong> Group operating data<br />
2005 2006 2007 2008 2009 <strong>2010</strong><br />
Volume of Water Produced (1) (3) 622.2 629.2 609.8 622.4 641.3 643.3<br />
Volume of Water Distributed (1) (4) 162.8 158.1 133.8 130.7 112.5 119.8<br />
Volume of Wastewater Treated/Invoiced (1) 238.3 310.1 312.9 357 392.8 472.3<br />
Volume of Urban Solid Waste Treated/Received (2) 3.2 3.4 3.5 3.7 3.6 3.7<br />
Number of employees 5,115 5,334 5,200 5,500 5,251 5,847<br />
(1) Unit: million m 3<br />
(2) Unit: million tons<br />
(3) Includes waters produced by EPAL, UNA-PD and UNI<br />
(4) Includes waters distributed by EPAL and UNI