

Annual Report 2010 - AdP
Annual Report 2010 - AdP
Annual Report 2010 - AdP

You also want an ePaper? Increase the reach of your titles
YUMPU automatically turns print PDFs into web optimized ePapers that Google loves.
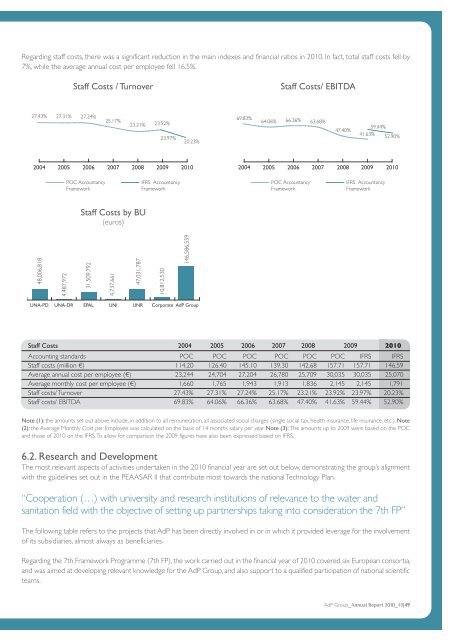
Regarding staff costs, there was a significant reduction in the main indexes and financial ratios in <strong>2010</strong>. In fact, total staff costs fell by<br />
7%, while the average annual cost per employee fell 16.5%.<br />
27.43% 27.31% 27.24%<br />
2004 2005 2006 2007 2008 2009 <strong>2010</strong><br />
48,006,818<br />
4,487,972<br />
Staff Costs / Turnover<br />
POC Accountancy<br />
Framework<br />
25.17%<br />
23.21%<br />
Staff Costs by BU<br />
(euros)<br />
31,509,792<br />
4,737,661<br />
47,031,787<br />
23.92%<br />
23.97%<br />
IFRS Accountancy<br />
Framework<br />
10,812,530<br />
20.23%<br />
146,586,559<br />
UNA-PD UNA-DR EPAL UNI UNR Corporate <strong>AdP</strong> Group<br />
2004 2005 2006 2007 2008 2009 <strong>2010</strong><br />
POC Accountancy<br />
Framework<br />
IFRS Accountancy<br />
Framework<br />
Note (1): the amounts set out above include, in addition to all remuneration, all associated social charges (single social tax, health insurance, life insurance, etc.). Note<br />
(2): the Average Monthly Cost per Employee was calculated on the basis of 14 months salary per year. Note (3): The amounts up to 2009 were based on the POC<br />
and those of <strong>2010</strong> on the IFRS. To allow for comparison the 2009 figures have also been expressed based on IFRS.<br />
6.2. Research and Development<br />
The most relevant aspects of activities undertaken in the <strong>2010</strong> financial year are set out below, demonstrating the group’s alignment<br />
with the guidelines set out in the PEAASAR II that contribute most towards the national Technology Plan.<br />
“Cooperation (…) with university and research institutions of relevance to the water and<br />
sanitation field with the objective of setting up partnerships taking into consideration the 7th FP”<br />
The following table refers to the projects that <strong>AdP</strong> has been directly involved in or in which it provided leverage for the involvement<br />
of its subsidiaries, almost always as beneficiaries.<br />
Regarding the 7th Framework Programme (7th FP), the work carried out in the financial year of <strong>2010</strong> covered six European consortia,<br />
and was aimed at developing relevant knowledge for the <strong>AdP</strong> Group, and also support to a qualified participation of national scientific<br />
teams.<br />
69.83%<br />
Staff Costs/ EBITDA<br />
64.06% 66.36% 63.68%<br />
47.40%<br />
59.44%<br />
41.63%<br />
52.90%<br />
Staff Costs 2004 2005 2006 2007 2008 2009 <strong>2010</strong><br />
Accounting standards POC POC POC POC POC POC IFRS IFRS<br />
Staff costs (million €) 114.20 126.40 145.10 139.30 142.68 157.71 157.71 146.59<br />
Average annual cost per employee (€) 23,244 24,704 27,204 26,780 25,709 30,035 30,035 25,070<br />
Average monthly cost per employee (€) 1,660 1,765 1,943 1,913 1,836 2,145 2,145 1,791<br />
Staff costs/ Turnover 27.43% 27.31% 27.24% 25.17% 23.21% 23.92% 23.97% 20.23%<br />
Staff costs/ EBITDA 69.83% 64.06% 66.36% 63.68% 47.40% 41.63% 59.44% 52.90%<br />
<strong>AdP</strong> Group_<strong>Annual</strong> <strong>Report</strong> <strong>2010</strong>_48|49