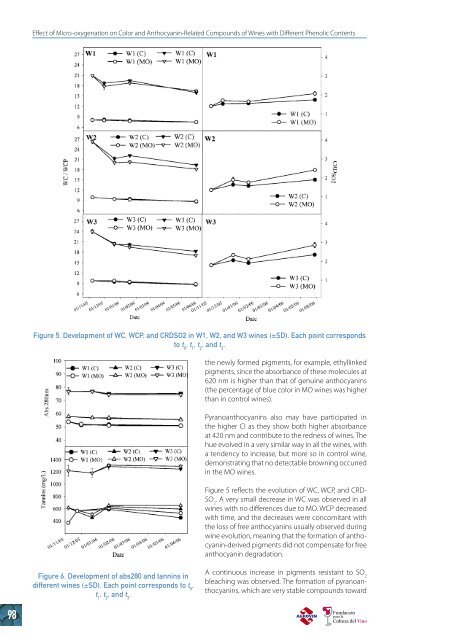
Effect of Micro-oxyg<strong>en</strong>ation on Color and Anthocyanin-Re<strong>la</strong>ted Compounds of Wines with Differ<strong>en</strong>t Ph<strong>en</strong>olic Cont<strong>en</strong>tsFigure 5. Developm<strong>en</strong>t of WC, WCP, and CRDSO2 in W1, W2, and W3 wines (±SD). Each point correspondsto t 0, t 1, t 2, and t 3.the newly formed pigm<strong>en</strong>ts, for example, ethyllinkedpigm<strong>en</strong>ts, since the absorbance of these molecules at620 nm is higher than that of g<strong>en</strong>uine anthocyanins(the perc<strong>en</strong>tage of blue color in MO wines was higherthan in control wines).Pyranoanthocyanins also may have participated inthe higher CI as they show both higher absorbanceat 420 nm and contribute to the redness of wines. Thehue evolved in a very simi<strong>la</strong>r way in all the wines, witha t<strong>en</strong>d<strong>en</strong>cy to increase, but more so in control wine,demonstrating that no detectable browning occurredin the MO wines.Figure 5 reflects the evolution of WC, WCP, and CRD-SO 2. A very small decrease in WC was observed in allwines with no differ<strong>en</strong>ces due to MO. WCP decreasedwith time, and the decreases were concomitant withthe loss of free anthocyanins usually observed duringwine evolution, meaning that the formation of anthocyanin-derivedpigm<strong>en</strong>ts did not comp<strong>en</strong>sate for freeanthocyanin degradation.Figure 6. Developm<strong>en</strong>t of abs280 and tannins indiffer<strong>en</strong>t wines (±SD). Each point corresponds to t 0,t 1, t 2, and t 3.A continuous increase in pigm<strong>en</strong>ts resistant to SO 2bleaching was observed. The formation of pyranoanthocyanins,which are very stable compounds toward98
Seminario Técnico<strong>Compuestos</strong> <strong>azufrados</strong> volátiles <strong>en</strong> <strong>vinos</strong>With regard to optical d<strong>en</strong>sity and tannin cont<strong>en</strong>t (Figure6) and mean degree of polymerization (mDP) (Figure7), no changes in abs280 were detected in any ofthe wines, indicating the abs<strong>en</strong>ce of significant winepigm<strong>en</strong>t precipitation. As regards tannins, their levelsdecreased during MLF in W2 and W3, but since nodecrease in abs280 was detected, this ph<strong>en</strong>om<strong>en</strong>onwas probably due to tannins breaking down to givesmall structures that were not detected by the BSAmethod. Simi<strong>la</strong>r values for the control and MO wineswere observed at t2. From t2 to t3, the conc<strong>en</strong>trationbarely changed, although MO wines showed a slightlyhigher tannin cont<strong>en</strong>t.Figure 7. Developm<strong>en</strong>t of mean degree ofpolymerization of tannins in W1, W2, and W3 wines(±SD). Each point corresponds to t 0, t 1, t 2, and t 3.Figure 8. Graphical plot repres<strong>en</strong>ting thedistribution of the wine samples in the p<strong>la</strong>nedefined by principal compon<strong>en</strong>ts 1 and 2 asregards their chromatic characteristics (MO wines:solid symbols; control wines: op<strong>en</strong> symbols; W1:circles; W2: squares; and W3: triangles). Thevariance exp<strong>la</strong>ined by each principal compon<strong>en</strong>t isshown in par<strong>en</strong>theses.SO 2and pH due to the substitution of C4 (47), wasprobably associated with this evolution. Ethyl-linkedcompounds also should be resistant to sulfite additionand may have contributed to the observed changes,exp<strong>la</strong>ining as to why the values were higher inMO wines.Differ<strong>en</strong>t behavior with regard to mDP was observedfor the differ<strong>en</strong>t wines. This <strong>para</strong>meter always increasedin the first period (from t0 to t1) for all wines and th<strong>en</strong>fell, except for W1. According to Nikfardjam and Dykes(53), this increase corresponds to the wine structuringphase described in empirical observations (13), and thisphase appears to occur irrespective of whether oxyg<strong>en</strong>is being dosed into the wine. The reduction of mDP observedafterward, mainly in W2 (MO) and W3 (MO), maybe due to a possible structural rearrangem<strong>en</strong>t of thetannins to shorter forms, which would corre<strong>la</strong>te withthe small decreases observed in the tannins measuredby the BSA method. This reduction in mDP may be responsiblefor a reduction in wine astring<strong>en</strong>cy (54, 55).The interaction of these newly formed intermediateswith anthocyanins also may reduce astring<strong>en</strong>cy sincethey can form terminal units of these shorter forms,prev<strong>en</strong>ting further polymerization (56). The differ<strong>en</strong>tbehavior of W1 (MO) was simi<strong>la</strong>r to that described byDu Toit et al. (57) wh<strong>en</strong> MO was applied to a wine fortoo long a period of time. It seems that W1 could havesuffered overoxyg<strong>en</strong>ation in the MO wine, and therefore,an increase of mDP was observed.Multivariate statistical analysis was used in this studyto check as to whether the wines could be groupedaccording to the variables studied. First, a clusteranalysis was conducted using all the studied variablessince this is a powerful visualization tool that <strong>en</strong>ablesgroupings to be observed within the data. This is anunsupervised method for pattern recognition, wherethe samples were clustered without prior knowledgeof their belonging to any wine type. The distance matrixwas calcu<strong>la</strong>ted using square Euclidean distancesand an average linkage method algorithm. Distancemeasures the simi<strong>la</strong>rity or dissimi<strong>la</strong>rity betwe<strong>en</strong> thediffer<strong>en</strong>t samples. Two clearly differ<strong>en</strong>tiated clusterswere found (data shown in Supporting Information).In one of them we found W1, both control and MO wines,and W2 (C), showing that W1 (C) and W2 (C) werequite close. W2 (MO) was c<strong>la</strong>ssified as closer to the W3wines. In the case of W2, it seems that MO originatedthe maximum differ<strong>en</strong>ces in the wine characteristics.MO promoted changes in its ph<strong>en</strong>olic structure, leadingto a wine with chromatic characteristics closer toa wine with a higher ph<strong>en</strong>olic cont<strong>en</strong>t.Textos asociados99