- Page 1 and 2: COMISIÓN INTERNACIONALpara laCONSE
- Page 4: PRESENTACIÓNEl Presidente de la Co
- Page 7 and 8: SESIONES PLENARIAS SCRS 1-8INFORME
- Page 9 and 10: SESIONES PLENARIAS SCRS 1-8BrasilEn
- Page 11 and 12: SESIONES PLENARIAS SCRS 1-8la de ra
- Page 13 and 14: SESIONES PLENARIAS SCRS 1-8que oper
- Page 15 and 16: SESIONES PLENARIAS SCRS 1-8respecti
- Page 17 and 18: SESIONES PLENARIAS SCRS 1-88 Resúm
- Page 19 and 20: RESUMEN EJECUTIVO YFTEn la pesquer
- Page 21 and 22: RESUMEN EJECUTIVO YFTconfirman que
- Page 23 and 24: 1986 1987 1988 1989 1990 1991 1992
- Page 25 and 26: 19a. YFT (LL) b. YFT (BB)c. YFT (PS
- Page 27 and 28: 250200Thousand tons15010050OthersLL
- Page 29 and 30: YFT-Figura 6. Tendencia en el peso
- Page 31 and 32: YFT-Figura 9. Situación actual (20
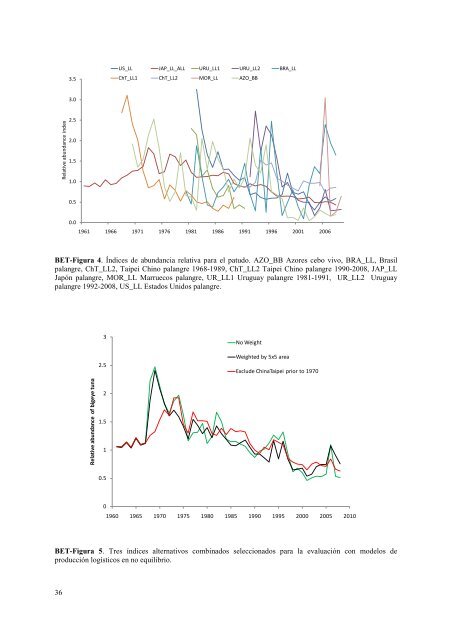
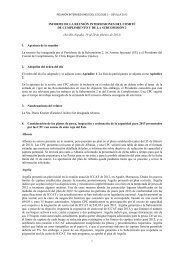
- Page 33 and 34: RESUMEN EJECUTIVO BET8.2 BET - PATU
- Page 35 and 36: RESUMEN EJECUTIVO BETpara los model
- Page 37 and 38: BET-Tabla 1. Capturas estimadas (t)
- Page 39 and 40: BET-Tabla 2. Probabilidades estimad
- Page 41: t1600001400001200001000008000060000
- Page 45 and 46: RESUMEN EJECUTIVO SKJ8.3 SKJ - LIST
- Page 47 and 48: RESUMEN EJECUTIVO SKJanalizaron tam
- Page 49 and 50: RESUMEN EJECUTIVO SKJRESUMEN DEL LI
- Page 51 and 52: 1986 1987 1988 1989 1990 1991 1992
- Page 53 and 54: 250000200000SKJ Task-I cumulative c
- Page 55 and 56: t4500040000350003000025000200001500
- Page 57 and 58: Apparent Z from length data3,532,52
- Page 59 and 60: SKJ-Figura 14. CPUE estandarizada p
- Page 61 and 62: RESUMEN EJECUTIVO ALB8.4 ALB - ATÚ
- Page 63 and 64: RESUMEN EJECUTIVO ALBrepresentan un
- Page 65 and 66: RESUMEN EJECUTIVO ALBALB-4. Perspec
- Page 67 and 68: ALB-Tabla 1. Capturas estimadas (t)
- Page 69 and 70: ALB-Tabla 2. Atún blanco del Atlá
- Page 71 and 72: a)700006000050000ALB-ATN: Task I by
- Page 73 and 74: 32.521.51Spain TR Age 2Spain TR Age
- Page 75 and 76: 3,532,5SSB/SSB msyF/FmsyRatio21,510
- Page 77 and 78: ALB-Figura 9. Atún blanco del Atl
- Page 79 and 80: ALB-Figura 12. Atún blanco del Atl
- Page 81 and 82: RESUMEN EJECUTIVO BFTE8.5 ATÚN ROJ
- Page 83 and 84: RESUMEN EJECUTIVO BFTEestimaciones
- Page 85 and 86: RESUMEN EJECUTIVO BFTElas 14.000 t
- Page 87 and 88: RESUMEN EJECUTIVO BFTWATÚN ROJO: O
- Page 89 and 90: RESUMEN EJECUTIVO BFTWComité no di
- Page 91 and 92: BFT-Tabla 1. Capturas estimadas (t)
- Page 93 and 94:
BFTE-Tabla 1. Probabilidades de que
- Page 95 and 96:
BFTE-Figura 1. Captura declarada pa
- Page 97 and 98:
0.40.3Run 13Run 15F 2-50.40.3Run 13
- Page 99 and 100:
BFTE-Figura 6. Diagrama de las prob
- Page 101 and 102:
(a)t2000018000160001400012000100008
- Page 103 and 104:
Fishing MortalitySSB (tonnes)Spawni
- Page 105 and 106:
A) 50% probability B) 60% probabili
- Page 107 and 108:
RESUMEN EJECUTIVO BUM-WHM8.6 BUM-WH
- Page 109 and 110:
RESUMEN EJECUTIVO BUM-WHMLos datos
- Page 111 and 112:
RESUMEN EJECUTIVO BUM-WHMRESUMEN DE
- Page 113 and 114:
1986 1987 1988 1989 1990 1991 1992
- Page 115 and 116:
1986 1987 1988 1989 1990 1991 1992
- Page 117 and 118:
BUM(1950-59)BUM(1960-69)BUM(1970-79
- Page 119 and 120:
t1000090008000700060005000400030002
- Page 121 and 122:
32.5F/FmsySSB/SSBmsy21.510.501955 1
- Page 123 and 124:
RESUMEN EJECUTIVO SAI8.7 SAI - PEZ
- Page 125 and 126:
SAI-Tabla 1A. Capturas estimadas (t
- Page 127 and 128:
SAI(1950-59)SAI(1960-69)SAI(1970-79
- Page 129 and 130:
3.5332.521.5JPN LL-3JPN LL-1JPN LL-
- Page 131 and 132:
RESUMEN EJECUTIVO SWO-ATLque las ca
- Page 133 and 134:
RESUMEN EJECUTIVO SWO-ATLascendiero
- Page 135 and 136:
SWO ATL-Tabla 1. Capturas estimadas
- Page 137 and 138:
a. SWO(1950-59)b. SWO(1960-69)c. SW
- Page 139 and 140:
SWO-ATL-Figura 3. Capturas declarad
- Page 141 and 142:
F Base 2009F /Fmsy Base 20090.50.45
- Page 143 and 144:
F/Fmsy0.0 0.5 1.0 1.5 2.00.0 0.5 1.
- Page 145 and 146:
SWO-ATL-Figura 13. Contornos de pro
- Page 147 and 148:
SWO-ATL-Figura 15. Contornos de pro
- Page 149 and 150:
RESUMEN EJECUTIVO SWO-MEDMediterrá
- Page 151 and 152:
RESUMEN EJECUTIVO SWO-MEDRESUMEN DE
- Page 153 and 154:
2500020000SWO-MED. Task-I CatchesOt
- Page 155 and 156:
SWO-MED-Figura 5. Tendencias tempor
- Page 157 and 158:
SWO-MED-Figura 8. Estimaciones del
- Page 159 and 160:
RESUMEN EJECUTIVO SMT8.11 SMT - PEQ
- Page 161 and 162:
RESUMEN EJECUTIVO SMTSMT-5. Perspec
- Page 163 and 164:
1986 1987 1988 1989 1990 1991 1992
- Page 165 and 166:
1986 1987 1988 1989 1990 1991 1992
- Page 167 and 168:
Task I: small tuna species (totals)
- Page 169 and 170:
BRS (Scomberomorus brasiliensis)120
- Page 171 and 172:
MAW (Scomberomorus tritor)t80007000
- Page 173 and 174:
RESUMEN EJECUTIVO SHKmarrajo sardin
- Page 175 and 176:
RESUMEN EJECUTIVO SHKSe estimó que
- Page 177 and 178:
RESUMEN EJECUTIVO SHKRESUMEN DEL MA
- Page 179 and 180:
POR-Tabla 1. Capturas estimadas de
- Page 181 and 182:
SHK-Tabla 2. Valores de productivid
- Page 183 and 184:
20018016014012010080604020019621964
- Page 185 and 186:
North West Porbeagle CPUE by fisher
- Page 187 and 188:
BSP and catch free model results10.
- Page 189 and 190:
SESIONES PLENARIAS SCRS 9-209 Infor
- Page 191 and 192:
SESIONES PLENARIAS SCRS 9-20El Comi
- Page 193 and 194:
SESIONES PLENARIAS SCRS 9-20• Cum
- Page 195 and 196:
SESIONES PLENARIAS SCRS 9-20Tabla 1
- Page 197 and 198:
SESIONES PLENARIAS SCRS 9-20Todas e
- Page 199 and 200:
SESIONES PLENARIAS SCRS 9-20Istiof
- Page 201 and 202:
SESIONES PLENARIAS SCRS 9-20El Comi
- Page 203 and 204:
SESIONES PLENARIAS SCRS 9-20SCRS/20
- Page 205 and 206:
SESIONES PLENARIAS SCRS 9-2019 Otro
- Page 207 and 208:
ORDEN DEL DÍA18.2 Examinar los dat
- Page 209 and 210:
LISTA DE PARTICIPANTESREP. DE COREA
- Page 211 and 212:
LISTA DE PARTICIPANTESFaraj, Abdelm
- Page 213 and 214:
LISTA DE PARTICIPANTESGaribaldi, Fu
- Page 215 and 216:
LISTA DE PARTICIPANTESOBSERVADORES
- Page 217 and 218:
LISTA DE PARTICIPANTESSECRETARÍA D
- Page 219 and 220:
LISTA DE DOCUMENTOSSCRS/2011/026SCR
- Page 221 and 222:
LISTA DE DOCUMENTOSSCRS/2011/061SCR
- Page 223 and 224:
LISTA DE DOCUMENTOSSCRS/2011/103SCR
- Page 225 and 226:
LISTA DE DOCUMENTOSSCRS/2011/142 Re
- Page 227 and 228:
LISTA DE DOCUMENTOSSCRS/2011/181SCR
- Page 229 and 230:
PLANES DE TRABAJOPLANES DE TRABAJO
- Page 231 and 232:
PLANES DE TRABAJOPlan de trabajo de
- Page 233 and 234:
PLANES DE TRABAJOEl Grupo recomiend
- Page 235 and 236:
PLANES DE TRABAJOSe continuarán re
- Page 237 and 238:
PLANES DE TRABAJO6) Continuar los e
- Page 239 and 240:
PLANES DE TRABAJOEl plan para 2012
- Page 241 and 242:
GBYPLas actividades de este Comité
- Page 243 and 244:
GBYPLa actividad de marcado será l
- Page 245 and 246:
GBYP3) Prospecciones aéreas, lo qu
- Page 247 and 248:
IERPBActividades y plan para 2012La
- Page 249 and 250:
IERPBLa consecuencia de que el Prog
- Page 251 and 252:
IERPBTabla 4. Gastos detallados pre
- Page 253 and 254:
SUBCOMITÉ DE ESTADÍSTICAS2.2 Tare
- Page 255 and 256:
SUBCOMITÉ DE ESTADÍSTICAScapturas
- Page 257 and 258:
SUBCOMITÉ DE ESTADÍSTICASAumentar
- Page 259 and 260:
SUBCOMITÉ DE ESTADÍSTICAS11 Plane
- Page 261 and 262:
SUBCOMITÉ DE ESTADÍSTICASTabla 2.
- Page 263 and 264:
SUBCOMITÉ DE ESTADÍSTICAS60 CP U.
- Page 265 and 266:
SUBCOMITÉ DE ESTADÍSTICASOrden de
- Page 267 and 268:
SUBCOMITÉ DE ESTADÍSTICASdesarrol
- Page 269 and 270:
SUBCOMITÉ DE ESTADÍSTICASComo en
- Page 271 and 272:
SUBCOMITÉ DE ESTADÍSTICASsiguen e
- Page 273 and 274:
SUBCOMITÉ DE ESTADÍSTICAS- El Gru
- Page 275 and 276:
SUBCOMITÉ DE ESTADÍSTICAS- Identi
- Page 277 and 278:
SUBCOMITÉ DE ECOSISTEMASINFORME DE
- Page 279 and 280:
SUBCOMITÉ DE ECOSISTEMASrecomendac
- Page 281 and 282:
REFERENCIASArocha, F., Moreno, C.,