UNIVERSITÉ D'ORLÉANS - Laboratoire de physique et chimie de l ...
UNIVERSITÉ D'ORLÉANS - Laboratoire de physique et chimie de l ...
UNIVERSITÉ D'ORLÉANS - Laboratoire de physique et chimie de l ...

Create successful ePaper yourself
Turn your PDF publications into a flip-book with our unique Google optimized e-Paper software.
Altitu<strong>de</strong> (m) p<br />
33000<br />
31000<br />
29000<br />
27000<br />
25000<br />
23000<br />
21000<br />
19000<br />
17000<br />
SPIRALE, 9 Juin 2008<br />
15000<br />
0 2 4 6 8 10 12<br />
O3 (ppbv)<br />
SPIRALE, 22 Juin 2005<br />
b)<br />
Altitu<strong>de</strong> (m) p<br />
a)<br />
Altitu<strong>de</strong> (m) p<br />
34000<br />
32000<br />
30000<br />
28000<br />
SPIRALE, 9 Juin 2008<br />
26000<br />
6 6.4 6.8 7.2 7.6 8 8.4 8.8 9.2 9.6 10 10.4 10.8 11.2 11.6 12<br />
23000<br />
22500<br />
22000<br />
21500<br />
21000<br />
20500<br />
20000<br />
19500<br />
19000<br />
SPIRALE, 22 Juin 2005<br />
O3 (ppbv)<br />
SPIRALE, 9 Juin 2008<br />
SPIRALE, 22 Juin 2005<br />
18500<br />
0 0.2 0.4 0.6 0.8 1 1.2 1.4 1.6 1.8 2 2.2 2.4 2.6 2.8 3 3.2 3.4<br />
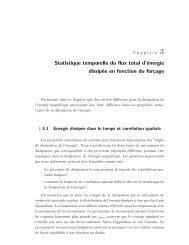
Figure 4-9– Profils verticaux <strong>de</strong> rapport <strong>de</strong> mélange d’ozone mesurés par SPIRALE lors <strong>de</strong> la<br />
campagne à Teresina (Brésil), le 22 Juin 2005 (en rouge) <strong>et</strong> le 9 Juin 2008 (en bleu) <strong>et</strong><br />
agrandissements entre (a) 18.5 <strong>et</strong> 23 km <strong>et</strong> (b) 26 <strong>et</strong> 34 km d’altitu<strong>de</strong>.<br />
4.2.2.1. Interprétation en lien avec la phase <strong>de</strong> la QBO<br />
Nous avons vu dans le premier chapitre que l’oscillation quasi-biennale peut être à l’origine<br />
<strong>de</strong> modifications dans la composition chimique <strong>de</strong>s masses d’air. Il est donc possible<br />
d’envisager qu’elle ait pu avoir une influence sur la composition chimique <strong>de</strong>s masses d’air<br />
sondées par SPIRALE. Un premier élément qui va dans ce sens est présenté sur la Figure<br />
4-10. Celle-ci présente la déviation par rapport à la moyenne (en %) mensuelle <strong>de</strong>s valeurs<br />
d’ozone sondées par l’instrument GOMOS (à bord du satellite ENVISAT) dans la ban<strong>de</strong> <strong>de</strong><br />
latitu<strong>de</strong> 0-15°S (Hauchecorne A., 2009, communication privée). C<strong>et</strong>te figure a été obtenue en<br />
r<strong>et</strong>irant la contribution <strong>de</strong> la variation saisonnière d’ozone <strong>et</strong> illustre donc l’influence <strong>de</strong> la<br />
phase <strong>de</strong> la QBO sur la teneur <strong>de</strong> ce composé (voir Sofieva <strong>et</strong> al., 2009 pour une <strong>de</strong>scription<br />
<strong>de</strong>s mesures d’ozone <strong>de</strong> GOMOS).<br />
O3 (ppbv)<br />
87