faits saillants de - Emploi-Québec
faits saillants de - Emploi-Québec
faits saillants de - Emploi-Québec

Create successful ePaper yourself
Turn your PDF publications into a flip-book with our unique Google optimized e-Paper software.
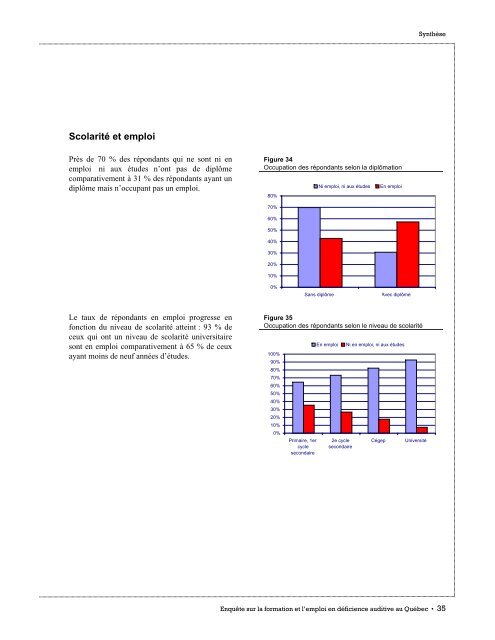
Scolarité et emploi<br />
Près <strong>de</strong> 70 % <strong>de</strong>s répondants qui ne sont ni en<br />
emploi ni aux étu<strong>de</strong>s n’ont pas <strong>de</strong> diplôme<br />
comparativement à 31 % <strong>de</strong>s répondants ayant un<br />
diplôme mais n’occupant pas un emploi.<br />
Le taux <strong>de</strong> répondants en emploi progresse en<br />
fonction du niveau <strong>de</strong> scolarité atteint : 93 % <strong>de</strong><br />
ceux qui ont un niveau <strong>de</strong> scolarité universitaire<br />
sont en emploi comparativement à 65 % <strong>de</strong> ceux<br />
ayant moins <strong>de</strong> neuf années d’étu<strong>de</strong>s.<br />
Figure 34<br />
Occupation <strong>de</strong>s répondants selon la diplômation<br />
80%<br />
70%<br />
60%<br />
50%<br />
40%<br />
30%<br />
20%<br />
10%<br />
0%<br />
Ni emploi, ni aux étu<strong>de</strong>s En emploi<br />
Figure 35<br />
Occupation <strong>de</strong>s répondants selon le niveau <strong>de</strong> scolarité<br />
100%<br />
90%<br />
80%<br />
70%<br />
60%<br />
50%<br />
40%<br />
30%<br />
20%<br />
10%<br />
0%<br />
Sans diplôme Avec diplôme<br />
En emploi Ni en emploi, ni aux étu<strong>de</strong>s<br />
Primaire, 1er 2e cycle Cégep Université<br />
cycle<br />
secondaire<br />
secondaire<br />
Synthèse<br />
Enquête sur la formation et l’emploi en déficience auditive au <strong>Québec</strong> • 35