macroinvertebrati acquatici e direttiva 2000/60/ec (wfd) - IRSA - Cnr
macroinvertebrati acquatici e direttiva 2000/60/ec (wfd) - IRSA - Cnr
macroinvertebrati acquatici e direttiva 2000/60/ec (wfd) - IRSA - Cnr

You also want an ePaper? Increase the reach of your titles
YUMPU automatically turns print PDFs into web optimized ePapers that Google loves.
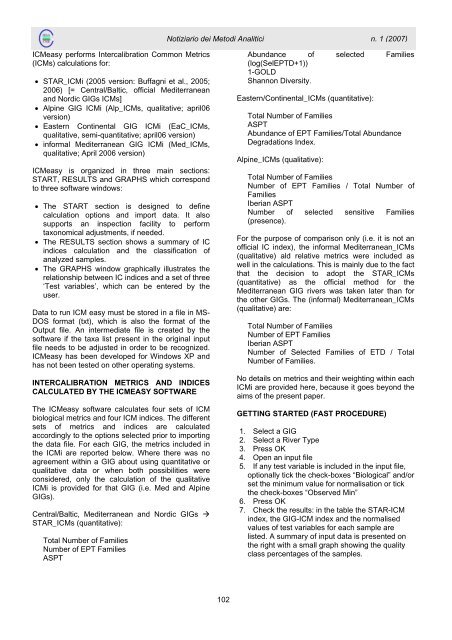
ICMeasy performs Intercalibration Common Metrics<br />
(ICMs) calculations for:<br />
• STAR_ICMi (2005 version: Buffagni et al., 2005;<br />
2006) [= Central/Baltic, official Mediterranean<br />
and Nordic GIGs ICMs]<br />
• Alpine GIG ICMi (Alp_ICMs, qualitative; april06<br />
version)<br />
• Eastern Continental GIG ICMi (EaC_ICMs,<br />
qualitative, semi-quantitative; april06 version)<br />
• informal Mediterranean GIG ICMi (Med_ICMs,<br />
qualitative; April 2006 version)<br />
ICMeasy is organized in three main s<strong>ec</strong>tions:<br />
START, RESULTS and GRAPHS which correspond<br />
to three software windows:<br />
• The START s<strong>ec</strong>tion is designed to define<br />
calculation options and import data. It also<br />
supports an insp<strong>ec</strong>tion facility to perform<br />
taxonomical adjustments, if needed.<br />
• The RESULTS s<strong>ec</strong>tion shows a summary of IC<br />
indices calculation and the classification of<br />
analyzed samples.<br />
• The GRAPHS window graphically illustrates the<br />
relationship between IC indices and a set of three<br />
‘Test variables’, which can be entered by the<br />
user.<br />
Data to run ICM easy must be stored in a file in MS-<br />
DOS format (txt), which is also the format of the<br />
Output file. An intermediate file is created by the<br />
software if the taxa list present in the original input<br />
file needs to be adjusted in order to be r<strong>ec</strong>ognized.<br />
ICMeasy has been developed for Windows XP and<br />
has not been tested on other operating systems.<br />
INTERCALIBRATION METRICS AND INDICES<br />
CALCULATED BY THE ICMEASY SOFTWARE<br />
The ICMeasy software calculates four sets of ICM<br />
biological metrics and four ICM indices. The different<br />
sets of metrics and indices are calculated<br />
accordingly to the options sel<strong>ec</strong>ted prior to importing<br />
the data file. For each GIG, the metrics included in<br />
the ICMi are reported below. Where there was no<br />
agreement within a GIG about using quantitative or<br />
qualitative data or when both possibilities were<br />
considered, only the calculation of the qualitative<br />
ICMi is provided for that GIG (i.e. Med and Alpine<br />
GIGs).<br />
Central/Baltic, Mediterranean and Nordic GIGs <br />
STAR_ICMs (quantitative):<br />
Total Number of Families<br />
Number of EPT Families<br />
ASPT<br />
Notiziario dei Metodi Analitici<br />
102<br />
n. 1 (2007)<br />
Abundance of sel<strong>ec</strong>ted Families<br />
(log(SelEPTD+1))<br />
1-GOLD<br />
Shannon Diversity.<br />
Eastern/Continental_ICMs (quantitative):<br />
Total Number of Families<br />
ASPT<br />
Abundance of EPT Families/Total Abundance<br />
Degradations Index.<br />
Alpine_ICMs (qualitative):<br />
Total Number of Families<br />
Number of EPT Families / Total Number of<br />
Families<br />
Iberian ASPT<br />
Number of sel<strong>ec</strong>ted sensitive Families<br />
(presence).<br />
For the purpose of comparison only (i.e. it is not an<br />
official IC index), the informal Mediterranean_ICMs<br />
(qualitative) ald relative metrics were included as<br />
well in the calculations. This is mainly due to the fact<br />
that the d<strong>ec</strong>ision to adopt the STAR_ICMs<br />
(quantitative) as the official method for the<br />
Mediterranean GIG rivers was taken later than for<br />
the other GIGs. The (informal) Mediterranean_ICMs<br />
(qualitative) are:<br />
Total Number of Families<br />
Number of EPT Families<br />
Iberian ASPT<br />
Number of Sel<strong>ec</strong>ted Families of ETD / Total<br />
Number of Families.<br />
No details on metrics and their weighting within each<br />
ICMi are provided here, b<strong>ec</strong>ause it goes beyond the<br />
aims of the present paper.<br />
GETTING STARTED (FAST PROCEDURE)<br />
1. Sel<strong>ec</strong>t a GIG<br />
2. Sel<strong>ec</strong>t a River Type<br />
3. Press OK<br />
4. Open an input file<br />
5. If any test variable is included in the input file,<br />
optionally tick the ch<strong>ec</strong>k-boxes “Biological” and/or<br />
set the minimum value for normalisation or tick<br />
the ch<strong>ec</strong>k-boxes “Observed Min”<br />
6. Press OK<br />
7. Ch<strong>ec</strong>k the results: in the table the STAR-ICM<br />
index, the GIG-ICM index and the normalised<br />
values of test variables for each sample are<br />
listed. A summary of input data is presented on<br />
the right with a small graph showing the quality<br />
class percentages of the samples.