- Page 3 and 4: c. Uso e consumo delle risorse.....
- Page 5 and 6: 7.2.1. Master in scienze del mare..
- Page 7 and 8: 1.1 Sintesi del lavoro svoltoIl Com
- Page 9 and 10: della Presidenza del Consiglio, fin
- Page 11 and 12: 2. ANALISI DI CONTESTO11
- Page 13 and 14: Una modalità alternativa di valori
- Page 15 and 16: Isola di Lipari 37,6 0-924 IAIsola
- Page 17 and 18: Durante l'era Quaternaria la Sicili
- Page 19 and 20: STAZIONI DI RETE SISMICA NAZIONALE
- Page 21 and 22: CARTA DELLA PERICOLOSITÀ VULCANICA
- Page 23 and 24: A Pantelleria le aree prospicienti
- Page 25 and 26: Nell’ecosistema delle Egadi, note
- Page 27 and 28: iusciva a trasportare carichi pesan
- Page 29 and 30: profilo floristico, con monotonia d
- Page 31 and 32: Ampiamente condivisi dalla popolazi
- Page 33: spedizione di Garibaldi in Sicilia.
- Page 37 and 38: Questi (dall’arabo “damus”: e
- Page 39 and 40: 12447s.n.c.AUTOPARCOCOMUNALE USTICA
- Page 41 and 42: TRAFFICO DI LINEA NAZIONALE 2001(AR
- Page 43 and 44: 1) Pantelleria - Trapani e vv.2) La
- Page 45 and 46: NAVI ARRIVATE, TONNELLATE DI STAZZA
- Page 47 and 48: .1. AgricolturaL’attività produt
- Page 49 and 50: attività si sviluppa soprattutto a
- Page 51 and 52: STRUTTURE ALBERGHIERE ED EXTRALBERG
- Page 53 and 54: SERVIZI OFFERTI NEI PORTI TURISTICI
- Page 55 and 56: L'industria estrattiva alle Eolie r
- Page 57 and 58: 9175.IALCIAL CISLSICILIAISO 9001:20
- Page 59 and 60: costruzione). La portata complessiv
- Page 61 and 62: RACCOLTA DIFFERENZIATA600500Pantell
- Page 63 and 64: Anche per le Isole Minori sono stat
- Page 65 and 66: Programma di prevenzione e interven
- Page 67 and 68: sicula; ancora non se ne conosce l'
- Page 69 and 70: di un villaggio preistorico fortifi
- Page 71 and 72: 2.4 La situazione delle pari opport
- Page 73 and 74: USTICA2) Analisi Swot di genere pre
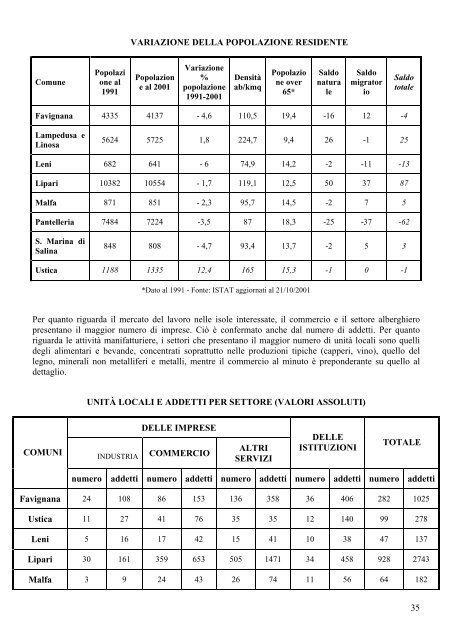
- Page 75 and 76: settore alberghiero, nei servizi di
- Page 77 and 78: Tra le altre osservazioni utili, l
- Page 79 and 80: più di 200 anni una tappa importan
- Page 81 and 82: Presenza delle donne nei luoghi dec
- Page 83 and 84: ScuolaEsistono sull’isola tutti i
- Page 85 and 86:
L’analisi della composizione dell
- Page 87 and 88:
40-59 664 .482 83 33 4.262 498 3.12
- Page 89 and 90:
) le scuole delle isole di Alicudi,
- Page 91 and 92:
I dettagli del programmaMisura 3.01
- Page 93 and 94:
• Costruire una nuova piattaforma
- Page 95 and 96:
Analisi e studi, Borse di studio, A
- Page 97 and 98:
3. IL QUADRO DELLA PROGRAMMAZIONE N
- Page 99 and 100:
. Numero di specie (indice di densi
- Page 101 and 102:
3.1.3. Lista del Patrimonio mondial
- Page 103 and 104:
Attuazione dell'accordo di programm
- Page 105 and 106:
Graduatorie degli interventi ammess
- Page 107 and 108:
Tab.05 - Elenco infrastrutture fina
- Page 109 and 110:
3.2.3. Il D.U.P.I.M. 2000-2006In co
- Page 111 and 112:
Le differenza più importante rispe
- Page 113 and 114:
3.2.6. I disegni di legge di inizia
- Page 115 and 116:
ATTI NORMATIVI ISTITUTIVI DELLE ARE
- Page 117 and 118:
ambienti termali;• Endemismi faun
- Page 119 and 120:
(G.U. n. 71 del26 marzo 1987)• Re
- Page 121 and 122:
L'area marina protetta delle "Isole
- Page 123 and 124:
Tra le aree tutelate in Sicilia, le
- Page 125 and 126:
• Progetto per il riatto di un pi
- Page 127 and 128:
Il Perastro, Melastro, Olivastro, S
- Page 129 and 130:
d) Progetto per la tabellazione e o
- Page 131 and 132:
e alle professionalità presenti su
- Page 133 and 134:
3.3.11.1. Il Patto Territoriale Pan
- Page 135 and 136:
3.3.12. Fonti energetiche rinnovabi
- Page 137 and 138:
Pit n.14 - Sistema turistico integr
- Page 139 and 140:
• a supporto dei programmi di mob
- Page 141 and 142:
3.3.16. Accordo di Programma Quadro
- Page 143 and 144:
PROGRAMMA DI ATTUAZIONE DELL’ACCO
- Page 145 and 146:
4. ANALISI SWOT145
- Page 147 and 148:
In questo capitolo vanno considerat
- Page 149 and 150:
sulle isole creando veri disservizi
- Page 151 and 152:
Fra le minacce, sono state segnalat
- Page 153 and 154:
5.1 L’idea forzaNel quadro degli
- Page 155 and 156:
La valorizzazione delle “risorse
- Page 157 and 158:
In questa accezione le isole rappre
- Page 159 and 160:
6. IDENTIFICAZIONE DELLA STRATEGIA
- Page 161 and 162:
Pertanto il modello organizzativo d
- Page 163 and 164:
• Accordo di Programma rete ecolo
- Page 165 and 166:
convenzioni suddette. Detti obietti
- Page 167 and 168:
L’Osservatorio si porrebbe quindi
- Page 169 and 170:
Per la realizzazione degli obiettiv
- Page 171 and 172:
LE SCHEDE DI AZIONI171
- Page 173 and 174:
- promuovere un’identificazione u
- Page 175 and 176:
Tabella Sottomisura 4.19 a)AzioniLi
- Page 177 and 178:
Tabella Sottomisura 4.19 b)AzioniAz
- Page 179 and 180:
Le notevoli potenzialità di svilup
- Page 181 and 182:
7.2 AZIONI DI SISTEMA AZIONI PUBBLI
- Page 183 and 184:
Il Centro, inoltre, dovrebbe diveni
- Page 185 and 186:
- Misura 4.18 azione A : uso di mod
- Page 187 and 188:
ammissibili ma non collocati utilme
- Page 189 and 190:
Beneficiari finaliI Comuni delle Is
- Page 191 and 192:
ALLEGATO 1
- Page 193 and 194:
Le categorie delle azioni ed interv
- Page 195 and 196:
5 MALFA 1 0,446 LAMPEDUSA E LINOSA
- Page 197 and 198:
2,65soggetti privati 33 14,60ordini
- Page 199 and 200:
turisticaEnergia 1.16 1.17Mercato d
- Page 201 and 202:
Tabella di conversione tra categori
- Page 203 and 204:
COSTITUZIONE DI SOCIETA' CONSORTILE
- Page 205 and 206:
giusta delibera del Consiglio diAmm
- Page 207 and 208:
Consortile a r. l.".>
- Page 209 and 210:
le Imprese, a ritirare le somme com
- Page 211 and 212:
imprenditoriali locali al fine di a
- Page 213 and 214:
di assicurare un utile apporto per
- Page 215 and 216:
meno otto giorni prima dell'adunanz
- Page 217 and 218:
La nomina degli amministratori spet
- Page 219 and 220:
L'assemblea che nomina i Sindaci no
- Page 221 and 222:
F.to: Braschi SalvatoreF.to: Floria
- Page 223 and 224:
MODELLO STRATEGICO DI ORGANIZZAZION
- Page 225 and 226:
Stromboli e Vulcano nelle Eolie dov
- Page 227 and 228:
ALLEGATO 4
- Page 229 and 230:
inoltrate da ciascun Ente, sono sta
- Page 231 and 232:
Allegato 4bANCIM SiciliaSCHEDA PER
- Page 233 and 234:
apporto tra il PIT e l'intervento p
- Page 235 and 236:
ALLEGATO 5
- Page 237 and 238:
CONSIDERATO‣ che i Comuni delle I
- Page 239 and 240:
inserire nel PIT al fine di rafforz
- Page 241 and 242:
Allegato 5bImporto da ripartire sec
- Page 243 and 244:
ammesse a finanziamento e il riferi
- Page 245 and 246:
- livello di definizione tecnica al
- Page 247 and 248:
2. dichiarazione del Responsabile U
- Page 249 and 250:
segue Riquadro 1A cura della Comm.n
- Page 251 and 252:
segue Riquadro IIA cura della Comm.
- Page 253 and 254:
segue Riquadro IIA cura della Comm.
- Page 255:
Segue Riquadro IIIA cura della Comm