Stichting Pensioenfonds Productschappen - PFP
Stichting Pensioenfonds Productschappen - PFP
Stichting Pensioenfonds Productschappen - PFP

Create successful ePaper yourself
Turn your PDF publications into a flip-book with our unique Google optimized e-Paper software.
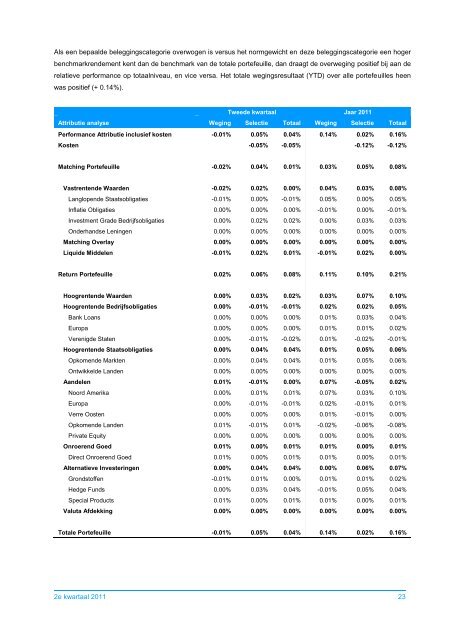
Als een bepaalde beleggingscategorie overwogen is versus het normgewicht en deze beleggingscategorie een hogerbenchmarkrendement kent dan de benchmark van de totale portefeuille, dan draagt de overweging positief bij aan derelatieve performance op totaalniveau, en vice versa. Het totale wegingsresultaat (YTD) over alle portefeuilles heenwas positief (+ 0.14%).Tweede kwartaal Jaar 2011Attributie analyse Weging Selectie Totaal Weging Selectie TotaalPerformance Attributie inclusief kosten -0.01% 0.05% 0.04% 0.14% 0.02% 0.16%Kosten -0.05% -0.05% -0.12% -0.12%Matching Portefeuille -0.02% 0.04% 0.01% 0.03% 0.05% 0.08%Vastrentende Waarden -0.02% 0.02% 0.00% 0.04% 0.03% 0.08%Langlopende Staatsobligaties -0.01% 0.00% -0.01% 0.05% 0.00% 0.05%Inflatie Obligaties 0.00% 0.00% 0.00% -0.01% 0.00% -0.01%Investment Grade Bedrijfsobligaties 0.00% 0.02% 0.02% 0.00% 0.03% 0.03%Onderhandse Leningen 0.00% 0.00% 0.00% 0.00% 0.00% 0.00%Matching Overlay 0.00% 0.00% 0.00% 0.00% 0.00% 0.00%Liquide Middelen -0.01% 0.02% 0.01% -0.01% 0.02% 0.00%Return Portefeuille 0.02% 0.06% 0.08% 0.11% 0.10% 0.21%Hoogrentende Waarden 0.00% 0.03% 0.02% 0.03% 0.07% 0.10%Hoogrentende Bedrijfsobligaties 0.00% -0.01% -0.01% 0.02% 0.02% 0.05%Bank Loans 0.00% 0.00% 0.00% 0.01% 0.03% 0.04%Europa 0.00% 0.00% 0.00% 0.01% 0.01% 0.02%Verenigde Staten 0.00% -0.01% -0.02% 0.01% -0.02% -0.01%Hoogrentende Staatsobligaties 0.00% 0.04% 0.04% 0.01% 0.05% 0.06%Opkomende Markten 0.00% 0.04% 0.04% 0.01% 0.05% 0.06%Ontwikkelde Landen 0.00% 0.00% 0.00% 0.00% 0.00% 0.00%Aandelen 0.01% -0.01% 0.00% 0.07% -0.05% 0.02%Noord Amerika 0.00% 0.01% 0.01% 0.07% 0.03% 0.10%Europa 0.00% -0.01% -0.01% 0.02% -0.01% 0.01%Verre Oosten 0.00% 0.00% 0.00% 0.01% -0.01% 0.00%Opkomende Landen 0.01% -0.01% 0.01% -0.02% -0.06% -0.08%Private Equity 0.00% 0.00% 0.00% 0.00% 0.00% 0.00%Onroerend Goed 0.01% 0.00% 0.01% 0.01% 0.00% 0.01%Direct Onroerend Goed 0.01% 0.00% 0.01% 0.01% 0.00% 0.01%Alternatieve Investeringen 0.00% 0.04% 0.04% 0.00% 0.06% 0.07%Grondstoffen -0.01% 0.01% 0.00% 0.01% 0.01% 0.02%Hedge Funds 0.00% 0.03% 0.04% -0.01% 0.05% 0.04%Special Products 0.01% 0.00% 0.01% 0.01% 0.00% 0.01%Valuta Afdekking 0.00% 0.00% 0.00% 0.00% 0.00% 0.00%Totale Portefeuille -0.01% 0.05% 0.04% 0.14% 0.02% 0.16%2e kwartaal 2011 23