Prevalência de resistência a antimicrobianos em isolados ...
Prevalência de resistência a antimicrobianos em isolados ...
Prevalência de resistência a antimicrobianos em isolados ...

Create successful ePaper yourself
Turn your PDF publications into a flip-book with our unique Google optimized e-Paper software.
Ana Martins<br />
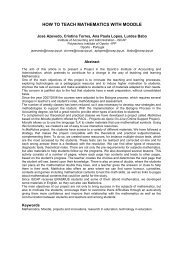
Gráfico XII- Relação entre as variáveis pH e contagens <strong>de</strong> microrganismos totais<br />
(22ºC) no ponto <strong>de</strong> amostrag<strong>em</strong> Freixo.<br />
UFC/100mL<br />
1,80E+06<br />
1,60E+06<br />
1,40E+06<br />
1,20E+06<br />
1,00E+06<br />
8,00E+05<br />
6,00E+05<br />
4,00E+05<br />
2,00E+05<br />
0,00E+00<br />
7,4 7,5 7,6 7,7 7,8 7,9 8<br />
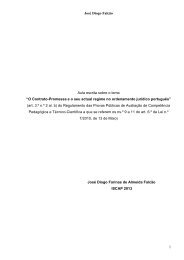
Gráfico XIII- Relação entre as variáveis pH e contagens <strong>de</strong> microrganismos totais<br />
(37ºC) no ponto <strong>de</strong> amostrag<strong>em</strong> Freixo.<br />
UFC/100mL<br />
1,80E+06<br />
1,60E+06<br />
1,40E+06<br />
1,20E+06<br />
1,00E+06<br />
8,00E+05<br />
6,00E+05<br />
4,00E+05<br />
2,00E+05<br />
Valores <strong>de</strong> pH<br />
0,00E+00<br />
7,4 7,5 7,6 7,7 7,8 7,9 8<br />
Valores <strong>de</strong> pH<br />
72<br />
y = -3E+06x + 2E+07<br />
R² = 0,5238<br />
microrganismos totais<br />
22ºC<br />
Linear<br />
(microrganismos totais<br />
22ºC)<br />
y = -3E+06x + 2E+07<br />
R² = 0,5485<br />
microrganismos totais<br />
37ºC<br />
Linear<br />
(microrganismos totais<br />
37ºC)