

sÃntese anual da agricultura de santa catarina 1995 - Cepa
sÃntese anual da agricultura de santa catarina 1995 - Cepa
sÃntese anual da agricultura de santa catarina 1995 - Cepa
- No tags were found...

Create successful ePaper yourself
Turn your PDF publications into a flip-book with our unique Google optimized e-Paper software.
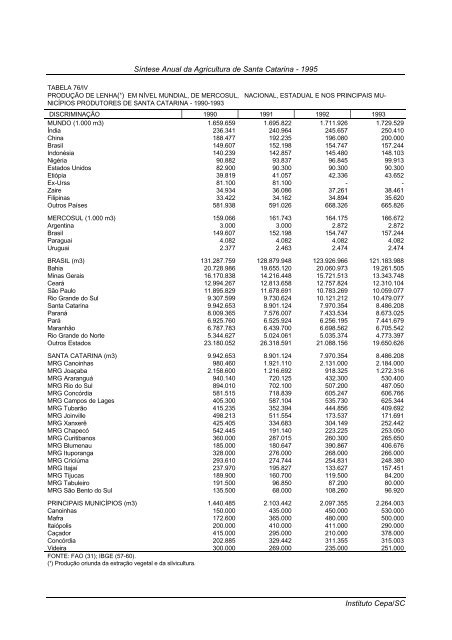
Síntese Anual <strong>da</strong> Agricultura <strong>de</strong> Santa Catarina - <strong>1995</strong>TABELA 76/IVPRODUÇÃO DE LENHA(¹) EM NÍVEL MUNDIAL, DE MERCOSUL, NACIONAL, ESTADUAL E NOS PRINCIPAIS MU-NICÍPIOS PRODUTORES DE SANTA CATARINA - 1990-1993DISCRIMINAÇÃO 1990 1991 1992 1993MUNDO (1.000 m3) 1.659.659 1.695.822 1.711.926 1.729.529Índia 236.341 240.964 245.657 250.410China 188.477 192.235 196.080 200.000Brasil 149.607 152.198 154.747 157.244Indonésia 140.239 142.857 145.480 148.103Nigéria 90.882 93.837 96.845 99.913Estados Unidos 82.900 90.300 90.300 90.300Etiópia 39.819 41.057 42.336 43.652Ex-Urss 81.100 81.100 - -Zaire 34.934 36.086 37.261 38.461Filipinas 33.422 34.162 34.894 35.620Outros Países 581.938 591.026 668.326 665.826MERCOSUL (1.000 m3) 159.066 161.743 164.175 166.672Argentina 3.000 3.000 2.872 2.872Brasil 149.607 152.198 154.747 157.244Paraguai 4.082 4.082 4.082 4.082Uruguai 2.377 2.463 2.474 2.474BRASIL (m3) 131.287.759 128.879.948 123.926.966 121.183.988Bahia 20.728.986 19.655.120 20.060.973 19.261.505Minas Gerais 16.170.838 14.216.448 15.721.513 13.343.748Ceará 12.994.267 12.813.658 12.757.824 12.310.104São Paulo 11.895.829 11.678.691 10.783.269 10.059.077Rio Gran<strong>de</strong> do Sul 9.307.599 9.730.624 10.121.212 10.479.077Santa Catarina 9.942.653 8.901.124 7.970.354 8.486.208Paraná 8.009.365 7.576.007 7.433.534 8.673.025Pará 6.925.760 6.525.924 6.256.195 7.441.679Maranhão 6.787.783 6.439.700 6.698.562 6.705.542Rio Gran<strong>de</strong> do Norte 5.344.627 5.024.061 5.035.374 4.773.397Outros Estados 23.180.052 26.318.591 21.088.156 19.650.626SANTA CATARINA (m3) 9.942.653 8.901.124 7.970.354 8.486.208MRG Canoinhas 980.460 1.921.110 2.131.000 2.184.000MRG Joaçaba 2.158.600 1.216.692 918.325 1.272.316MRG Araranguá 940.140 720.125 432.300 530.400MRG Rio do Sul 894.010 702.100 507.200 487.050MRG Concórdia 581.515 718.839 605.247 606.766MRG Campos <strong>de</strong> Lages 405.300 587.104 535.730 625.344MRG Tubarão 415.235 352.394 444.856 409.692MRG Joinville 498.213 511.554 173.537 171.691MRG Xanxerê 425.405 334.683 304.149 252.442MRG Chapecó 542.445 191.140 223.225 253.050MRG Curitibanos 360.000 287.015 260.300 265.650MRG Blumenau 185.000 180.647 390.867 406.676MRG Ituporanga 328.000 276.000 268.000 266.000MRG Criciúma 293.610 274.744 254.831 248.380MRG Itajaí 237.970 195.827 133.627 157.451MRG Tijucas 189.900 160.700 119.500 84.200MRG Tabuleiro 191.500 96.850 87.200 80.000MRG São Bento do Sul 135.500 68.000 108.260 96.920PRINCIPAIS MUNICÍPIOS (m3) 1.440.485 2.103.442 2.097.355 2.264.003Canoinhas 150.000 435.000 450.000 530.000Mafra 172.600 365.000 480.000 500.000Itaiópolis 200.000 410.000 411.000 290.000Caçador 415.000 295.000 210.000 378.000Concórdia 202.885 329.442 311.355 315.003Vi<strong>de</strong>ira 300.000 269.000 235.000 251.000FONTE: FAO (31); IBGE (57-60).(¹) Produção oriun<strong>da</strong> <strong>da</strong> extração vegetal e <strong>da</strong> silvicultura.Instituto <strong>Cepa</strong>/SC


