

sÃntese anual da agricultura de santa catarina 1995 - Cepa
sÃntese anual da agricultura de santa catarina 1995 - Cepa
sÃntese anual da agricultura de santa catarina 1995 - Cepa
- No tags were found...

Create successful ePaper yourself
Turn your PDF publications into a flip-book with our unique Google optimized e-Paper software.
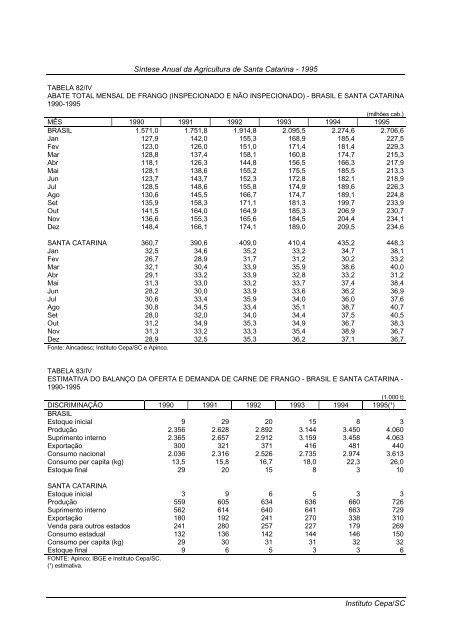
Síntese Anual <strong>da</strong> Agricultura <strong>de</strong> Santa Catarina - <strong>1995</strong>TABELA 82/IVABATE TOTAL MENSAL DE FRANGO (INSPECIONADO E NÃO INSPECIONADO) - BRASIL E SANTA CATARINA1990-<strong>1995</strong>(milhões cab.)MÊS 1990 1991 1992 1993 1994 <strong>1995</strong>BRASIL 1.571,0 1.751,8 1.914,8 2.095,5 2.274,6 2.706,6Jan 127,9 142,0 155,3 168,9 185,4 227,5Fev 123,0 126,0 151,0 171,4 181,4 229,3Mar 128,8 137,4 158,1 160,8 174,7 215,3Abr 118,1 126,3 144,8 156,5 166,3 217,9Mai 128,1 138,6 155,2 175,5 185,5 213,3Jun 123,7 143,7 152,3 172,8 182,1 218,9Jul 128,5 148,6 155,8 174,9 189,6 226,3Ago 130,6 145,5 166,7 174,7 189,1 224,8Set 135,9 158,3 171,1 181,3 199,7 233,9Out 141,5 164,0 164,9 185,3 206,9 230,7Nov 136,6 155,3 165,6 184,5 204,4 234,1Dez 148,4 166,1 174,1 189,0 209,5 234,6SANTA CATARINA 360,7 390,6 409,0 410,4 435,2 448,3Jan 32,5 34,6 35,2 33,2 34,7 38,1Fev 26,7 28,9 31,7 31,2 30,2 33,2Mar 32,1 30,4 33,9 35,9 38,6 40,0Abr 29,1 33,2 33,9 32,8 33,2 31,2Mai 31,3 33,0 33,2 33,7 37,4 38,4Jun 28,2 30,0 33,9 33,6 36,2 36,9Jul 30,6 33,4 35,9 34,0 36,0 37,6Ago 30,8 34,5 33,4 35,1 38,7 40,7Set 28,0 32,0 34,0 34,4 37,5 40,5Out 31,2 34,9 35,3 34,9 36,7 38,3Nov 31,3 33,2 33,3 35,4 38,9 36,7Dez 28,9 32,5 35,3 36,2 37,1 36,7Fonte: Ainca<strong>de</strong>sc; Instituto <strong>Cepa</strong>/SC e Apinco.TABELA 83/IVESTIMATIVA DO BALANÇO DA OFERTA E DEMANDA DE CARNE DE FRANGO - BRASIL E SANTA CATARINA -1990-<strong>1995</strong>(1.000 t)DISCRIMINAÇÃO 1990 1991 1992 1993 1994 <strong>1995</strong>(¹)BRASILEstoque inicial 9 29 20 15 8 3Produção 2.356 2.628 2.892 3.144 3.450 4.060Suprimento interno 2.365 2.657 2.912 3.159 3.458 4.063Exportação 300 321 371 416 481 440Consumo nacional 2.036 2.316 2.526 2.735 2.974 3.613Consumo per capita (kg) 13,5 15,8 16,7 18,0 22,3 26,0Estoque final 29 20 15 8 3 10SANTA CATARINAEstoque inicial 3 9 6 5 3 3Produção 559 605 634 636 660 726Suprimento interno 562 614 640 641 663 729Exportação 180 192 241 270 338 310Ven<strong>da</strong> para outros estados 241 280 257 227 179 269Consumo estadual 132 136 142 144 146 150Consumo per capita (kg) 29 30 31 31 32 32Estoque final 9 6 5 3 3 6FONTE: Apinco; IBGE e Instituto <strong>Cepa</strong>/SC.(¹) estimativa.Instituto <strong>Cepa</strong>/SC


