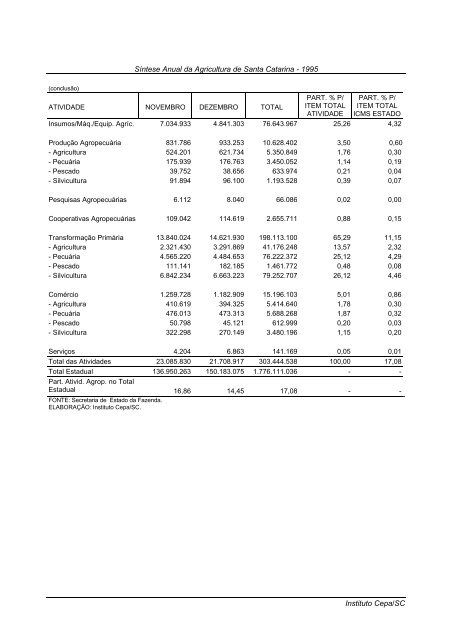
Síntese Anual <strong>da</strong> Agricultura <strong>de</strong> Santa Catarina - <strong>1995</strong>(conclusão)ATIVIDADE NOVEMBRO DEZEMBRO TOTALPART. % P/ITEM TOTALATIVIDADEPART. % P/ITEM TOTALICMS ESTADOInsumos/Máq./Equip. Agríc. 7.034.933 4.841.303 76.643.967 25,26 4,32Produção Agropecuária 831.786 933.253 10.628.402 3,50 0,60- Agricultura 524.201 621.734 5.350.849 1,76 0,30- Pecuária 175.939 176.763 3.450.052 1,14 0,19- Pescado 39.752 38.656 633.974 0,21 0,04- Silvicultura 91.894 96.100 1.193.528 0,39 0,07Pesquisas Agropecuárias 6.112 8.040 66.086 0,02 0,00Cooperativas Agropecuárias 109.042 114.619 2.655.711 0,88 0,15Transformação Primária 13.840.024 14.621.930 198.113.100 65,29 11,15- Agricultura 2.321.430 3.291.869 41.176.248 13,57 2,32- Pecuária 4.565.220 4.484.653 76.222.372 25,12 4,29- Pescado 111.141 182.185 1.461.772 0,48 0,08- Silvicultura 6.842.234 6.663.223 79.252.707 26,12 4,46Comércio 1.259.728 1.182.909 15.196.103 5,01 0,86- Agricultura 410.619 394.325 5.414.640 1,78 0,30- Pecuária 476.013 473.313 5.688.268 1,87 0,32- Pescado 50.798 45.121 612.999 0,20 0,03- Silvicultura 322.298 270.149 3.480.196 1,15 0,20Serviços 4.204 6.863 141.169 0,05 0,01Total <strong>da</strong>s Ativi<strong>da</strong><strong>de</strong>s 23.085.830 21.708.917 303.444.538 100,00 17,08Total Estadual 136.950.263 150.183.075 1.776.111.036 - -Part. Ativid. Agrop. no TotalEstadual 16,86 14,45 17,08 - -FONTE: Secretaria <strong>de</strong> Estado <strong>da</strong> Fazen<strong>da</strong>.ELABORAÇÃO: Instituto <strong>Cepa</strong>/SC.Instituto <strong>Cepa</strong>/SC
4.3. INDICADORES ECONÔMICOSSíntese Anual <strong>da</strong> Agricultura <strong>de</strong> Santa Catarina - <strong>1995</strong>TABELA 9/IVVALOR MÉDIO MENSAL DO DÓLAR COMERCIAL AMERICANO (ven<strong>da</strong>) - 1990-<strong>1995</strong>(em moe<strong>da</strong> corrente)MÊS 1990 1991 1992 1993 1994 <strong>1995</strong>Janeiro 14,313 193,189 1.197,377 14.059,142 390,845 0,847Fevereiro 23,661 221,756 1.478,655 17.868,592 550,807 0,841Março 37,701 230,085 1.814,518 22.469,246 768,120 0,889Abril 47,890 252,175 2.196,784 28.728,942 1.109,564 0,908Maio 52,230 272,977 2.628,642 37.040,310 1.585,475 0,897Junho 57,116 297,871 3.149,767 48.106,460 2.296,256 0,914Julho 66,517 328,922 3.829,196 62.773,236 0,933 0,929Agosto 71,757 371,282 4.672,143 82,740 0,899 0,942Setembro 75,541 428,951 5.771,524 111,189 0,865 0,953Outubro 95,165 583,852 7.214,900 151,225 0,846 0,960Novembro 123,133 740,367 9.046,797 205,801 0,842 0,964Dezembro 154,586 957,874 11.150,875 279,385 0,850 0,968FONTE: Bacen (12-13).Nota: De 15 jan/89 a 14 mar/90 = Cruzado Novo; <strong>de</strong> 15 mar/90 a 31 jul/93 = Cruzeiro; <strong>de</strong> 01 ago/93 a 30 jun/94 = Cruzeiro Real, a partir<strong>de</strong> 1 jul/94 = Real.TABELA 10/IVÍNDICE GERAL DE PREÇOS - DISPONIBILIDADE INTERNA (IGP-DI) - 1990-<strong>1995</strong>(base ago/94=100)MÊS 1990 1991 1992 1993 1994 <strong>1995</strong>Janeiro 0,0004782 0,0052601 0,0322754 0,4120532 12,7827404 108,7850000Fevereiro 0,0008210 0,0063703 0,0402778 0,5212683 18,2039627 110,0390000Março 0,0014886 0,0068320 0,0486157 0,6662375 26,3639800 112,0350000Abril 0,0016573 0,0074290 0,0576303 0,8542270 37,5573723 114,6140000Maio 0,0018076 0,0079138 0,0705660 1,1298574 52,9374596 115,0710000Junho 0,0019706 0,0086942 0,0856786 1,4769962 77,5942020 118,0900000Julho 0,0022264 0,0098095 0,1042640 1,9490985 96,7677525 120,7330000Agosto 0,0025142 0,0113289 0,1308937 2,6026604 100,0000000 122,2890000Setembro 0,0028088 0,0131635 0,1667255 3,5654943 101,5490000 120,9670000Outubro 0,0032065 0,0165659 0,2083038 4,8185868 104,1430000 121,2410000Novembro 0,0037661 0,0208337 0,2587649 6,5996055 106,7200000 122,8500000Dezembro 0,0043858 0,0254456 0,3200911 8,9899175 107,3250000 123,1870000FONTE: FGV.Obs: A taxa <strong>de</strong> julho/94, que <strong>de</strong>ve ser utiliza<strong>da</strong> para correção <strong>de</strong> contratos, conforme Lei n° 8.880 e Medi<strong>da</strong>Provisória n° 566, foi <strong>de</strong> 5,47%.Instituto <strong>Cepa</strong>/SC