

sÃntese anual da agricultura de santa catarina 1995 - Cepa
sÃntese anual da agricultura de santa catarina 1995 - Cepa
sÃntese anual da agricultura de santa catarina 1995 - Cepa
- No tags were found...

Create successful ePaper yourself
Turn your PDF publications into a flip-book with our unique Google optimized e-Paper software.
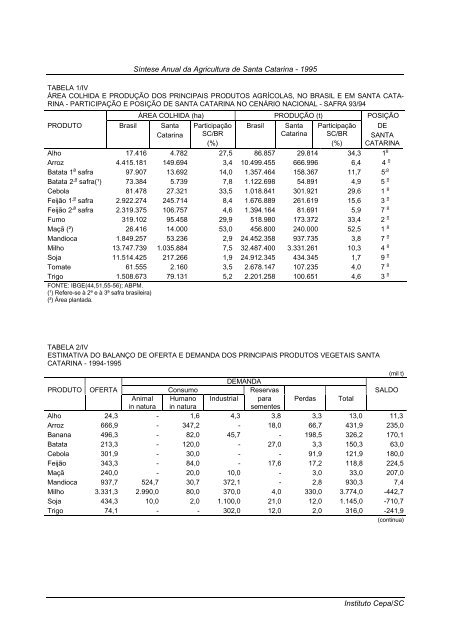
Síntese Anual <strong>da</strong> Agricultura <strong>de</strong> Santa Catarina - <strong>1995</strong>TABELA 1/IVÁREA COLHIDA E PRODUÇÃO DOS PRINCIPAIS PRODUTOS AGRÍCOLAS, NO BRASIL E EM SANTA CATA-RINA - PARTICIPAÇÃO E POSIÇÃO DE SANTA CATARINA NO CENÁRIO NACIONAL - SAFRA 93/94ÁREA COLHIDA (ha) PRODUÇÃO (t) POSIÇÃOPRODUTO Brasil SantaCatarinaParticipaçãoSC/BR(%)Brasil SantaCatarinaParticipaçãoSC/BR(%)DESANTACATARINAAlho 17.416 4.782 27,5 86.857 29.814 34,3 1 oArroz 4.415.181 149.694 3,4 10.499.455 666.996 6,4 4 oBatata 1 a safra 97.907 13.692 14,0 1.357.464 158.367 11,7 5 oBatata 2 a safra(¹) 73.384 5.739 7,8 1.122.698 54.891 4,9 5 oCebola 81.478 27.321 33,5 1.018.841 301.921 29,6 1 oFeijão 1 a safra 2.922.274 245.714 8,4 1.676.889 261.619 15,6 3 oFeijão 2 a safra 2.319.375 106.757 4,6 1.394.164 81.691 5,9 7 oFumo 319.102 95.458 29,9 518.980 173.372 33,4 2 oMaçã (²) 26.416 14.000 53,0 456.800 240.000 52,5 1 oMandioca 1.849.257 53.236 2,9 24.452.358 937.735 3,8 7 oMilho 13.747.739 1.035.884 7,5 32.487.400 3.331.261 10,3 4 oSoja 11.514.425 217.266 1,9 24.912.345 434.345 1,7 9 oTomate 61.555 2.160 3,5 2.678.147 107.235 4,0 7 oTrigo 1.508.673 79.131 5,2 2.201.258 100.651 4,6 3 oFONTE: IBGE(44,51,55-56); ABPM.(¹) Refere-se à 2ª e à 3ª safra brasileira)(²) Área planta<strong>da</strong>.TABELA 2/IVESTIMATIVA DO BALANÇO DE OFERTA E DEMANDA DOS PRINCIPAIS PRODUTOS VEGETAIS SANTACATARINA - 1994-<strong>1995</strong>(mil t)DEMANDAPRODUTO OFERTA Consumo Reservas SALDOAnimal Humano Industrial para Per<strong>da</strong>s Totalin natura in naturasementesAlho 24,3 - 1,6 4,3 3,8 3,3 13,0 11,3Arroz 666,9 - 347,2 - 18,0 66,7 431,9 235,0Banana 496,3 - 82,0 45,7 - 198,5 326,2 170,1Batata 213,3 - 120,0 - 27,0 3,3 150,3 63,0Cebola 301,9 - 30,0 - - 91,9 121,9 180,0Feijão 343,3 - 84,0 - 17,6 17,2 118,8 224,5Maçã 240,0 - 20,0 10,0 - 3,0 33,0 207,0Mandioca 937,7 524,7 30,7 372,1 - 2,8 930,3 7,4Milho 3.331,3 2.990,0 80,0 370,0 4,0 330,0 3.774,0 -442,7Soja 434,3 10,0 2,0 1.100,0 21,0 12,0 1.145,0 -710,7Trigo 74,1 - - 302,0 12,0 2,0 316,0 -241,9(continua)Instituto <strong>Cepa</strong>/SC


