

sÃntese anual da agricultura de santa catarina 1995 - Cepa
sÃntese anual da agricultura de santa catarina 1995 - Cepa
sÃntese anual da agricultura de santa catarina 1995 - Cepa
- No tags were found...

You also want an ePaper? Increase the reach of your titles
YUMPU automatically turns print PDFs into web optimized ePapers that Google loves.
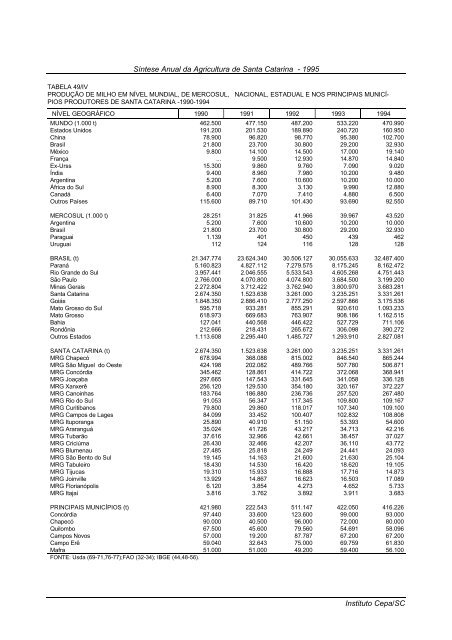
Síntese Anual <strong>da</strong> Agricultura <strong>de</strong> Santa Catarina - <strong>1995</strong>TABELA 49/IVPRODUÇÃO DE MILHO EM NÍVEL MUNDIAL, DE MERCOSUL, NACIONAL, ESTADUAL E NOS PRINCIPAIS MUNICÍ-PIOS PRODUTORES DE SANTA CATARINA -1990-1994NÍVEL GEOGRÁFICO 1990 1991 1992 1993 1994MUNDO (1.000 t) 462.500 477.150 487.200 533.220 470.990Estados Unidos 191.200 201.530 189.890 240.720 160.950China 78.900 96.820 98.770 95.380 102.700Brasil 21.800 23.700 30.800 29.200 32.930México 9.800 14.100 14.500 17.000 19.140França ... 9.500 12.930 14.870 14.840Ex-Urss 15.300 9.860 9.760 7.090 9.020Índia 9.400 8.960 7.980 10.200 9.480Argentina 5.200 7.600 10.600 10.200 10.000África do Sul 8.900 8.300 3.130 9.990 12.880Canadá 6.400 7.070 7.410 4.880 6.500Outros Países 115.600 89.710 101.430 93.690 92.550MERCOSUL (1.000 t) 28.251 31.825 41.966 39.967 43.520Argentina 5.200 7.600 10.600 10.200 10.000Brasil 21.800 23.700 30.800 29.200 32.930Paraguai 1.139 401 450 439 462Uruguai 112 124 116 128 128BRASIL (t) 21.347.774 23.624.340 30.506.127 30.055.633 32.487.400Paraná 5.160.823 4.827.112 7.279.575 8.175.245 8.162.472Rio Gran<strong>de</strong> do Sul 3.957.441 2.046.555 5.533.543 4.605.268 4.751.443São Paulo 2.766.000 4.070.800 4.074.800 3.684.500 3.199.200Minas Gerais 2.272.804 3.712.422 3.762.940 3.800.970 3.683.281Santa Catarina 2.674.350 1.523.638 3.261.000 3.235.251 3.331.261Goiás 1.848.350 2.886.410 2.777.250 2.597.866 3.175.536Mato Grosso do Sul 595.718 933.281 855.291 920.610 1.093.233Mato Grosso 618.973 669.683 763.907 908.186 1.162.515Bahia 127.041 440.568 446.422 527.729 711.106Rondônia 212.666 218.431 265.672 306.098 390.272Outros Estados 1.113.608 2.295.440 1.485.727 1.293.910 2.827.081SANTA CATARINA (t) 2.674.350 1.523.638 3.261.000 3.235.251 3.331.261MRG Chapecó 678.994 368.088 815.002 846.540 865.244MRG São Miguel do Oeste 424.198 202.082 489.766 507.780 506.871MRG Concórdia 345.462 128.861 414.722 372.068 368.941MRG Joaçaba 297.665 147.543 331.645 341.058 336.128MRG Xanxerê 256.120 129.530 354.180 320.167 372.227MRG Canoinhas 183.764 186.880 236.736 257.520 267.480MRG Rio do Sul 91.053 56.347 117.345 109.800 109.167MRG Curitibanos 79.800 29.860 118.017 107.340 109.100MRG Campos <strong>de</strong> Lages 84.099 33.452 100.407 102.832 108.808MRG Ituporanga 25.890 40.910 51.150 53.393 54.600MRG Araranguá 35.024 41.726 43.217 34.713 42.216MRG Tubarão 37.616 32.966 42.661 38.457 37.027MRG Criciúma 26.430 32.466 42.207 36.110 43.772MRG Blumenau 27.485 25.818 24.249 24.441 24.093MRG São Bento do Sul 19.145 14.163 21.600 21.630 25.104MRG Tabuleiro 18.430 14.530 16.420 18.620 19.105MRG Tijucas 19.310 15.933 16.888 17.716 14.873MRG Joinville 13.929 14.867 16.623 16.503 17.089MRG Florianópolis 6.120 3.854 4.273 4.652 5.733MRG Itajaí 3.816 3.762 3.892 3.911 3.683PRINCIPAIS MUNICÍPIOS (t) 421.980 222.543 511.147 422.050 416.226Concórdia 97.440 33.600 123.600 99.000 93.000Chapecó 90.000 40.500 96.000 72.000 80.000Quilombo 67.500 45.600 79.560 54.691 58.096Campos Novos 57.000 19.200 87.787 67.200 67.200Campo Erê 59.040 32.643 75.000 69.759 61.830Mafra 51.000 51.000 49.200 59.400 56.100FONTE: Us<strong>da</strong> (69-71,76-77);FAO (32-34); IBGE (44,48-56).Instituto <strong>Cepa</strong>/SC


