

sÃntese anual da agricultura de santa catarina 1995 - Cepa
sÃntese anual da agricultura de santa catarina 1995 - Cepa
sÃntese anual da agricultura de santa catarina 1995 - Cepa
- No tags were found...

You also want an ePaper? Increase the reach of your titles
YUMPU automatically turns print PDFs into web optimized ePapers that Google loves.
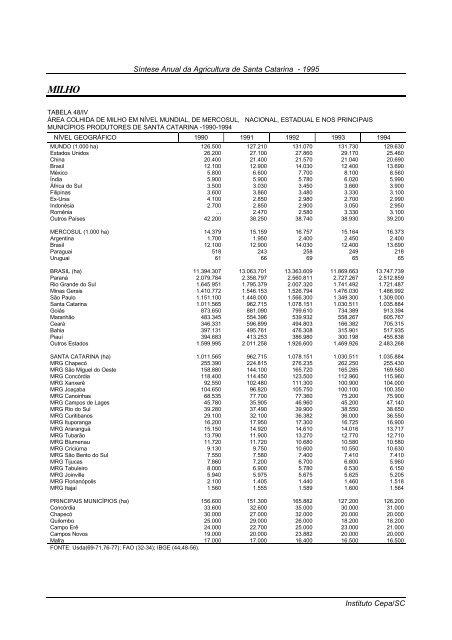
Síntese Anual <strong>da</strong> Agricultura <strong>de</strong> Santa Catarina - <strong>1995</strong>MILHOTABELA 48/IVÁREA COLHIDA DE MILHO EM NÍVEL MUNDIAL, DE MERCOSUL, NACIONAL, ESTADUAL E NOS PRINCIPAISMUNICÍPIOS PRODUTORES DE SANTA CATARINA -1990-1994NÍVEL GEOGRÁFICO 1990 1991 1992 1993 1994MUNDO (1.000 ha) 126.500 127.210 131.070 131.730 129.630Estados Unidos 26.200 27.100 27.860 29.170 25.460China 20.400 21.400 21.570 21.040 20.690Brasil 12.100 12.900 14.030 12.400 13.690México 5.800 6.600 7.700 8.100 8.560Índia 5.900 5.900 5.780 6.020 5.990África do Sul 3.500 3.030 3.450 3.660 3.900Filipinas 3.600 3.860 3.480 3.330 3.100Ex-Urss 4.100 2.850 2.980 2.700 2.990Indonésia 2.700 2.850 2.900 3.050 2.950Romênia ... 2.470 2.580 3.330 3.100Outros Países 42.200 38.250 38.740 38.930 39.200MERCOSUL (1.000 ha) 14.379 15.159 16.757 15.164 16.373Argentina 1.700 1.950 2.400 2.450 2.400Brasil 12.100 12.900 14.030 12.400 13.690Paraguai 518 243 258 249 218Uruguai 61 66 69 65 65BRASIL (ha) 11.394.307 13.063.701 13.363.609 11.869.663 13.747.739Paraná 2.079.784 2.358.797 2.560.811 2.727.267 2.512.859Rio Gran<strong>de</strong> do Sul 1.645.951 1.795.379 2.007.320 1.741.492 1.721.487Minas Gerais 1.410.772 1.546.153 1.526.794 1.476.030 1.486.992São Paulo 1.151.100 1.448.000 1.566.300 1.349.300 1.309.000Santa Catarina 1.011.565 962.715 1.078.151 1.030.511 1.035.884Goiás 873.650 881.090 799.610 734.389 913.394Maranhão 483.345 554.396 539.932 558.267 605.767Ceará 346.331 596.899 494.803 166.382 705.315Bahia 397.131 495.761 476.308 315.901 517.935Piauí 394.683 413.253 386.980 300.198 455.838Outros Estados 1.599.995 2.011.258 1.926.600 1.469.926 2.483.268SANTA CATARINA (ha) 1.011.565 962.715 1.078.151 1.030.511 1.035.884MRG Chapecó 255.390 224.815 276.235 262.250 255.430MRG São Miguel do Oeste 158.880 144.100 165.720 165.285 169.560MRG Concórdia 118.400 114.450 123.500 112.960 115.960MRG Xanxerê 92.550 102.480 111.300 100.900 104.000MRG Joaçaba 104.650 96.820 105.750 100.100 100.350MRG Canoinhas 68.535 77.700 77.360 75.200 75.900MRG Campos <strong>de</strong> Lages 45.780 35.905 46.960 45.200 47.140MRG Rio do Sul 39.280 37.490 39.900 38.550 38.650MRG Curitibanos 29.100 32.100 36.382 36.000 36.550MRG Ituporanga 16.200 17.950 17.300 16.725 16.900MRG Araranguá 15.150 14.920 14.610 14.016 13.717MRG Tubarão 13.790 11.900 13.270 12.770 12.710MRG Blumenau 11.720 11.720 10.680 10.580 10.580MRG Criciúma 9.130 9.750 10.600 10.550 10.630MRG São Bento do Sul 7.550 7.580 7.400 7.410 7.410MRG Tijucas 7.860 7.200 6.700 6.800 5.960MRG Tabuleiro 8.000 6.900 5.780 6.530 6.150MRG Joinville 5.940 5.975 5.675 5.625 5.205MRG Florianópolis 2.100 1.405 1.440 1.460 1.518MRG Itajaí 1.560 1.555 1.589 1.600 1.564PRINCIPAIS MUNICÍPIOS (ha) 156.600 151.300 165.882 127.200 126.200Concórdia 33.600 32.600 35.000 30.000 31.000Chapecó 30.000 27.000 32.000 20.000 20.000Quilombo 25.000 29.000 26.000 18.200 18.200Campo Erê 24.000 22.700 25.000 23.000 21.000Campos Novos 19.000 20.000 23.882 20.000 20.000Mafra 17.000 17.000 16.400 16.500 16.500FONTE: Us<strong>da</strong>(69-71,76-77); FAO (32-34); IBGE (44,48-56).Instituto <strong>Cepa</strong>/SC


