

sÃntese anual da agricultura de santa catarina 1995 - Cepa
sÃntese anual da agricultura de santa catarina 1995 - Cepa
sÃntese anual da agricultura de santa catarina 1995 - Cepa
- No tags were found...

Create successful ePaper yourself
Turn your PDF publications into a flip-book with our unique Google optimized e-Paper software.
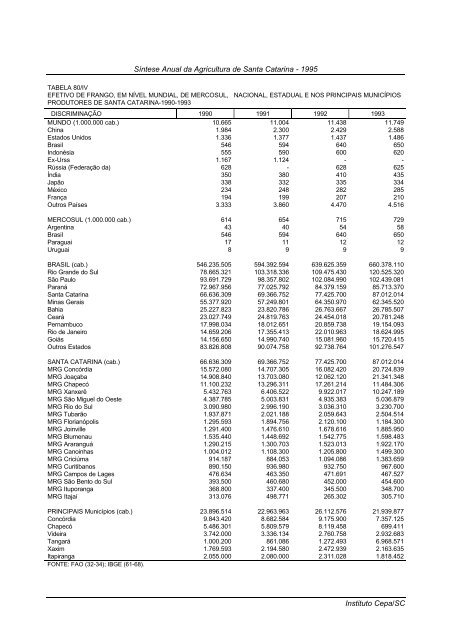
Síntese Anual <strong>da</strong> Agricultura <strong>de</strong> Santa Catarina - <strong>1995</strong>TABELA 80/IVEFETIVO DE FRANGO, EM NÍVEL MUNDIAL, DE MERCOSUL, NACIONAL, ESTADUAL E NOS PRINCIPAIS MUNICÍPIOSPRODUTORES DE SANTA CATARINA-1990-1993DISCRIMINAÇÃO 1990 1991 1992 1993MUNDO (1.000.000 cab.) 10.665 11.004 11.438 11.749China 1.984 2.300 2.429 2.588Estados Unidos 1.336 1.377 1.437 1.486Brasil 546 594 640 650Indonésia 555 590 600 620Ex-Urss 1.167 1.124 - -Rússia (Fe<strong>de</strong>ração <strong>da</strong>) 628 - 628 625Índia 350 380 410 435Japão 338 332 335 334México 234 248 282 285França 194 199 207 210Outros Países 3.333 3.860 4.470 4.516MERCOSUL (1.000.000 cab.) 614 654 715 729Argentina 43 40 54 58Brasil 546 594 640 650Paraguai 17 11 12 12Uruguai 8 9 9 9BRASIL (cab.) 546.235.505 594.392.594 639.625.359 660.378.110Rio Gran<strong>de</strong> do Sul 78.665.321 103.318.336 109.475.430 120.525.320São Paulo 93.691.729 98.357.802 102.084.990 102.439.081Paraná 72.967.956 77.025.792 84.379.159 85.713.370Santa Catarina 66.636.309 69.366.752 77.425.700 87.012.014Minas Gerais 55.377.920 57.249.801 64.350.970 62.345.520Bahia 25.227.823 23.820.786 26.763.667 26.785.507Ceará 23.027.749 24.819.763 24.454.018 20.781.248Pernambuco 17.998.034 18.012.651 20.859.738 19.154.093Rio <strong>de</strong> Janeiro 14.659.206 17.355.413 22.010.963 18.624.995Goiás 14.156.650 14.990.740 15.081.960 15.720.415Outros Estados 83.826.808 90.074.758 92.738.764 101.276.547SANTA CATARINA (cab.) 66.636.309 69.366.752 77.425.700 87.012.014MRG Concórdia 15.572.080 14.707.305 16.082.420 20.724.839MRG Joaçaba 14.908.840 13.703.080 12.062.120 21.341.348MRG Chapecó 11.100.232 13.296.311 17.261.214 11.484.306MRG Xanxerê 5.432.763 6.406.522 9.922.017 10.247.189MRG São Miguel do Oeste 4.387.785 5.003.831 4.935.383 5.036.879MRG Rio do Sul 3.090.980 2.996.190 3.036.310 3.230.700MRG Tubarão 1.937.871 2.021.188 2.059.643 2.504.514MRG Florianópolis 1.295.593 1.894.756 2.120.100 1.184.300MRG Joinville 1.291.400 1.476.610 1.678.616 1.885.950MRG Blumenau 1.535.440 1.448.692 1.542.775 1.598.483MRG Araranguá 1.290.215 1.300.703 1.523.013 1.922.170MRG Canoinhas 1.004.012 1.108.300 1.205.800 1.499.300MRG Criciúma 914.187 884.053 1.094.086 1.383.659MRG Curitibanos 890.150 936.980 932.750 967.600MRG Campos <strong>de</strong> Lages 476.634 463.350 471.691 467.527MRG São Bento do Sul 393.500 460.680 452.000 454.600MRG Ituporanga 368.800 337.400 345.500 348.700MRG Itajaí 313.076 498.771 265.302 305.710PRINCIPAIS Municípios (cab.) 23.896.514 22.963.963 26.112.576 21.939.877Concórdia 9.843.420 8.682.584 9.175.900 7.357.125Chapecó 5.486.301 5.809.579 8.119.458 699.411Vi<strong>de</strong>ira 3.742.000 3.336.134 2.760.758 2.932.683Tangará 1.000.200 861.086 1.272.493 6.968.571Xaxim 1.769.593 2.194.580 2.472.939 2.163.635Itapiranga 2.055.000 2.080.000 2.311.028 1.818.452FONTE: FAO (32-34); IBGE (61-68).Instituto <strong>Cepa</strong>/SC


