

sÃntese anual da agricultura de santa catarina 1995 - Cepa
sÃntese anual da agricultura de santa catarina 1995 - Cepa
sÃntese anual da agricultura de santa catarina 1995 - Cepa
- No tags were found...

Create successful ePaper yourself
Turn your PDF publications into a flip-book with our unique Google optimized e-Paper software.
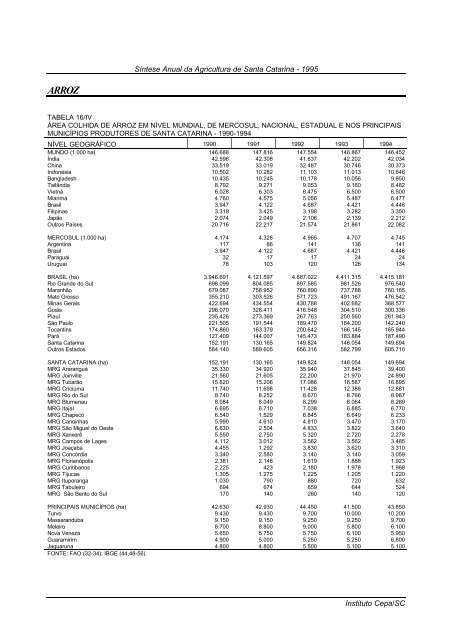
Síntese Anual <strong>da</strong> Agricultura <strong>de</strong> Santa Catarina - <strong>1995</strong>ARROZTABELA 16/IVÁREA COLHIDA DE ARROZ EM NÍVEL MUNDIAL, DE MERCOSUL, NACIONAL, ESTADUAL E NOS PRINCIPAISMUNICÍPIOS PRODUTORES DE SANTA CATARINA - 1990-1994NÍVEL GEOGRÁFICO 1990 1991 1992 1993 1994MUNDO (1.000 ha) 146.688 147.816 147.554 146.867 146.452Índia 42.596 42.308 41.637 42.202 42.034China 33.519 33.019 32.487 30.746 30.373Indonésia 10.502 10.282 11.103 11.013 10.646Bangla<strong>de</strong>sh 10.435 10.245 10.178 10.056 9.850Tailândia 8.792 9.271 9.053 9.160 8.482Vietnã 6.028 6.303 6.475 6.500 6.500Mianmá 4.760 4.575 5.056 5.487 6.477Brasil 3.947 4.122 4.687 4.421 4.446Filipinas 3.319 3.425 3.198 3.282 3.350Japão 2.074 2.049 2.106 2.139 2.212Outros Países 20.716 22.217 21.574 21.861 22.082MERCOSUL (1.000 ha) 4.174 4.328 4.965 4.707 4.745Argentina 117 86 141 136 141Brasil 3.947 4.122 4.687 4.421 4.446Paraguai 32 17 17 24 24Uruguai 78 103 120 126 134BRASIL (ha) 3.946.691 4.121.597 4.687.022 4.411.315 4.415.181Rio Gran<strong>de</strong> do Sul 698.099 804.085 897.585 981.526 976.540Maranhão 679.087 758.952 760.890 737.788 760.165Mato Grosso 355.210 303.526 571.723 491.167 476.542Minas Gerais 422.694 434.554 430.788 402.682 368.577Goiás 296.070 328.411 416.548 304.510 300.336Piauí 235.426 273.369 267.763 250.560 281.943São Paulo 221.505 191.544 189.470 164.200 142.240Tocantins 174.860 163.379 200.642 166.145 165.944Pará 127.409 144.007 145.473 183.884 187.490Santa Catarina 152.191 130.165 149.824 146.054 149.694Outros Estados 584.140 589.605 656.316 582.799 605.710SANTA CATARINA (ha) 152.191 130.165 149.824 146.054 149.694MRG Araranguá 35.330 34.920 35.940 37.845 39.400MRG Joinville 21.560 21.605 22.200 21.970 24.890MRG Tubarão 15.620 15.206 17.086 16.587 16.895MRG Criciúma 11.740 11.698 11.428 12.388 12.881MRG Rio do Sul 8.740 8.252 8.670 8.766 8.987MRG Blumenau 8.084 8.049 8.299 8.064 8.289MRG Itajaí 6.695 6.710 7.038 6.885 6.770MRG Chapecó 6.540 1.529 6.845 6.640 6.233MRG Canoinhas 5.990 4.610 4.810 3.470 3.170MRG São Miguel do Oeste 6.630 2.504 4.833 3.822 3.640MRG Xanxerê 5.550 2.750 5.320 2.720 2.278MRG Campos <strong>de</strong> Lages 4.112 3.012 3.562 3.562 3.485MRG Joaçaba 4.455 1.292 3.830 3.620 3.310MRG Concórdia 3.340 2.580 3.140 3.140 3.059MRG Florianópolis 2.381 2.146 1.619 1.888 1.923MRG Curitibanos 2.225 423 2.180 1.978 1.988MRG Tijucas 1.305 1.275 1.225 1.205 1.220MRG Ituporanga 1.030 790 880 720 632MRG Tabuleiro 694 674 659 644 524MRG São Bento do Sul 170 140 260 140 120PRINCIPAIS MUNICÍPIOS (ha) 42.630 42.930 44.450 41.500 43.850Turvo 9.430 9.430 9.700 10.000 10.200Massaranduba 9.150 9.150 9.250 9.250 9.700Meleiro 8.700 8.800 9.000 5.800 6.100Nova Veneza 5.650 5.750 5.750 6.100 5.950Guaramirim 4.900 5.000 5.250 5.250 6.800Jaguaruna 4.800 4.800 5.500 5.100 5.100FONTE: FAO (32-34); IBGE (44,48-56).Instituto <strong>Cepa</strong>/SC


