

sÃntese anual da agricultura de santa catarina 1995 - Cepa
sÃntese anual da agricultura de santa catarina 1995 - Cepa
sÃntese anual da agricultura de santa catarina 1995 - Cepa
- No tags were found...

Create successful ePaper yourself
Turn your PDF publications into a flip-book with our unique Google optimized e-Paper software.
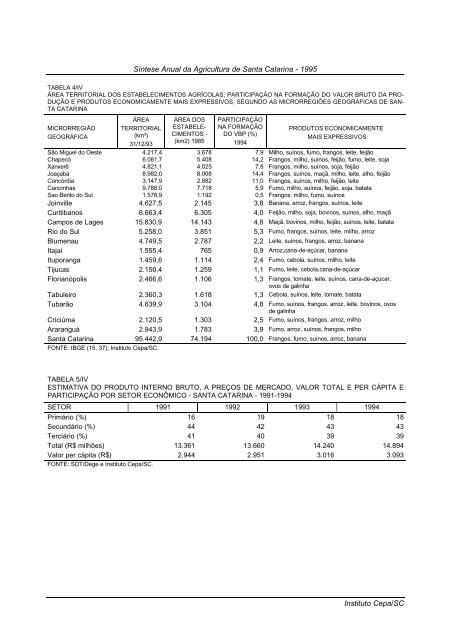
Síntese Anual <strong>da</strong> Agricultura <strong>de</strong> Santa Catarina - <strong>1995</strong>TABELA 4/IVÁREA TERRITORIAL DOS ESTABELECIMENTOS AGRÍCOLAS, PARTICIPAÇÃO NA FORMAÇÃO DO VALOR BRUTO DA PRO-DUÇÃO E PRODUTOS ECONOMICAMENTE MAIS EXPRESSIVOS, SEGUNDO AS MICRORREGIÕES GEOGRÁFICAS DE SAN-TA CATARINAMICRORREGIÃOGEOGRÁFICAÁREATERRITORIAL(km²)31/12/93ÁREA DOSESTABELE-CIMENTOS -(km2) 1985PARTICIPAÇÃONA FORMAÇÃODO VBP (%)1994PRODUTOS ECONOMICAMENTEMAIS EXPRESSIVOSSão Miguel do Oeste 4.217,4 3.678 7,9 Milho, suínos, fumo, frangos, leite, feijãoChapecó 6.081,7 5.408 14,2 Frangos, milho, suínos, feijão, fumo, leite, sojaXanxerê 4.821,1 4.025 7,8 Frangos, milho, suínos, soja, feijãoJoaçaba 8.982,0 8.008 14,4 Frangos, suínos, maçã, milho, leite, alho, feijãoConcórdia 3.147,9 2.882 11,0 Frangos, suínos, milho, feijão, leiteCanoinhas 9.788,0 7.718 5,9 Fumo, milho, suínos, feijão, soja, batataSao Bento do Sul 1.578,9 1.192 0,5 Frangos, milho, fumo, suínosJoinville 4.627,5 2.145 3,8 Banana, arroz, frangos, suínos, leiteCuritibanos 6.663,4 6.305 4,0 Feijão, milho, soja, bovinos, suínos, alho, maçãCampos <strong>de</strong> Lages 15.830,9 14.143 4,8 Maçã, bovinos, milho, feijão, suínos, leite, batataRio do Sul 5.258,0 3.851 5,3 Fumo, frangos, suínos, leite, milho, arrozBlumenau 4.749,5 2.787 2,2 Leite, suínos, frangos, arroz, bananaItajaí 1.555,4 765 0,9 Arroz,cana-<strong>de</strong>-açúcar, bananaItuporanga 1.459,6 1.114 2,4 Fumo, cebola, suínos, milho, leiteTijucas 2.150,4 1.259 1,1 Fumo, leite, cebola,cana-<strong>de</strong>-açúcarFlorianópolis 2.466,6 1.106 1,3 Frangos, tomate, leite, suínos, cana-<strong>de</strong>-açúcar,ovos <strong>de</strong> galinhaTabuleiro 2.360,3 1.618 1,3 Cebola, suínos, leite, tomate, batataTubarão 4.639,9 3.104 4,8 Fumo, suínos, frangos, arroz, leite, bovinos, ovos<strong>de</strong> galinhaCriciúma 2.120,5 1.303 2,5 Fumo, suínos, frangos, arroz, milhoAraranguá 2.943,9 1.783 3,9 Fumo, arroz, suínos, frangos, milhoSanta Catarina 95.442,9 74.194 100,0 Frangos, fumo, suínos, arroz, bananaFONTE: IBGE (15, 37); Instituto <strong>Cepa</strong>/SC.TABELA 5/IVESTIMATIVA DO PRODUTO INTERNO BRUTO, A PREÇOS DE MERCADO, VALOR TOTAL E PER CÁPITA EPARTICIPAÇÃO POR SETOR ECONÔMICO - SANTA CATARINA - 1991-1994SETOR 1991 1992 1993 1994Primário (%) 16 19 18 18Secundário (%) 44 42 43 43Terciário (%) 41 40 39 39Total (R$ milhões) 13.361 13.660 14.240 14.894Valor per cápita (R$) 2.944 2.951 3.016 3.093FONTE: SDT/Dege e Instituto <strong>Cepa</strong>/SC.Instituto <strong>Cepa</strong>/SC


