

sÃntese anual da agricultura de santa catarina 1995 - Cepa
sÃntese anual da agricultura de santa catarina 1995 - Cepa
sÃntese anual da agricultura de santa catarina 1995 - Cepa
- No tags were found...

You also want an ePaper? Increase the reach of your titles
YUMPU automatically turns print PDFs into web optimized ePapers that Google loves.
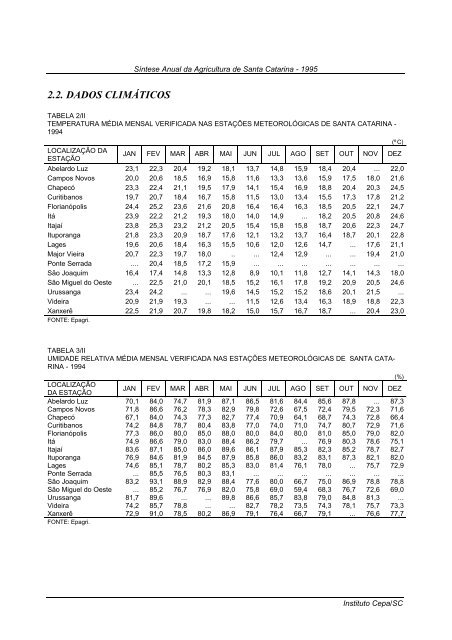
Síntese Anual <strong>da</strong> Agricultura <strong>de</strong> Santa Catarina - <strong>1995</strong>2.2. DADOS CLIMÁTICOSTABELA 2/IITEMPERATURA MÉDIA MENSAL VERIFICADA NAS ESTAÇÕES METEOROLÓGICAS DE SANTA CATARINA -1994(ºC)LOCALIZAÇÃO DAESTAÇÃOJAN FEV MAR ABR MAI JUN JUL AGO SET OUT NOV DEZAbelardo Luz 23,1 22,3 20,4 19,2 18,1 13,7 14,8 15,9 18,4 20,4 ... 22,0Campos Novos 20,0 20,6 18,5 16,9 15,8 11,6 13,3 13,6 15,9 17,5 18,0 21,6Chapecó 23,3 22,4 21,1 19,5 17,9 14,1 15,4 16,9 18,8 20,4 20,3 24,5Curitibanos 19,7 20,7 18,4 16,7 15,8 11,5 13,0 13,4 15,5 17,3 17,8 21,2Florianópolis 24,4 25,2 23,6 21,6 20,8 16,4 16,4 16,3 18,5 20,5 22,1 24,7Itá 23,9 22,2 21,2 19,3 18,0 14,0 14,9 ... 18,2 20,5 20,8 24,6Itajaí 23,8 25,3 23,2 21,2 20,5 15,4 15,8 15,8 18,7 20,6 22,3 24,7Ituporanga 21,8 23,3 20,9 18,7 17,6 12,1 13,2 13,7 16,4 18,7 20,1 22,8Lages 19,6 20,6 18,4 16,3 15,5 10,6 12,0 12,6 14,7 ... 17,6 21,1Major Vieira 20,7 22,3 19,7 18,0 .. ... 12,4 12,9 ... ... 19,4 21,0Ponte Serra<strong>da</strong> .... 20,4 18,5 17,2 15,9 ... ... ... ... ... ... ...São Joaquim 16,4 17,4 14,8 13,3 12,8 8,9 10,1 11,8 12,7 14,1 14,3 18,0São Miguel do Oeste ... 22,5 21,0 20,1 18,5 15,2 16,1 17,8 19,2 20,9 20,5 24,6Urussanga 23,4 24,2 ... ... 19,6 14,5 15,2 15,2 18,6 20,1 21,5 ...Vi<strong>de</strong>ira 20,9 21,9 19,3 ... ... 11,5 12,6 13,4 16,3 18,9 18,8 22,3Xanxerê 22,5 21,9 20,7 19,8 18,2 15,0 15,7 16,7 18,7 ... 20,4 23,0FONTE: Epagri.TABELA 3/IIUMIDADE RELATIVA MÉDIA MENSAL VERIFICADA NAS ESTAÇÕES METEOROLÓGICAS DE SANTA CATA-RINA - 1994(%)LOCALIZAÇÃODA ESTAÇÃOJAN FEV MAR ABR MAI JUN JUL AGO SET OUT NOV DEZAbelardo Luz 70,1 84,0 74,7 81,9 87,1 86,5 81,6 84,4 85,6 87,8 ... 87,3Campos Novos 71,8 86,6 76,2 78,3 82,9 79,8 72,6 67,5 72,4 79,5 72,3 71,6Chapecó 67,1 84,0 74,3 77,3 82,7 77,4 70,9 64,1 68,7 74,3 72,8 66,4Curitibanos 74,2 84,8 78,7 80,4 83,8 77,0 74,0 71,0 74,7 80,7 72,9 71,6Florianópolis 77,3 86,0 80,0 85,0 88,0 80,0 84,0 80,0 81,0 85,0 79,0 82,0Itá 74,9 86,6 79,0 83,0 88,4 86,2 79,7 ... 76,9 80,3 78,6 75,1Itajaí 83,6 87,1 85,0 86,0 89,6 86,1 87,9 85,3 82,3 85,2 78,7 82,7Ituporanga 76,9 84,6 81,9 84,5 87,9 85,8 86,0 83,2 83,1 87,3 82,1 82,0Lages 74,6 85,1 78,7 80,2 85,3 83,0 81,4 76,1 78,0 ... 75,7 72,9Ponte Serra<strong>da</strong> ... 85,5 76,5 80,3 83,1 ... ... ... ... ... ... ...São Joaquim 83,2 93,1 88,9 82,9 88,4 77,6 80,0 66,7 75,0 86,9 78,8 78,8São Miguel do Oeste ... 85,2 76,7 76,9 82,0 75,8 69,0 59,4 68,3 76,7 72,6 69,0Urussanga 81,7 89,6 ... ... 89,8 86,6 85,7 83,8 79,0 84,8 81,3 ...Vi<strong>de</strong>ira 74,2 85,7 78,8 ... ... 82,7 78,2 73,5 74,3 78,1 75,7 73,3Xanxerê 72,9 91,0 78,5 80,2 86,9 79,1 76,4 66,7 79,1 ... 76,6 77,7FONTE: Epagri.Instituto <strong>Cepa</strong>/SC


