

sÃntese anual da agricultura de santa catarina 1995 - Cepa
sÃntese anual da agricultura de santa catarina 1995 - Cepa
sÃntese anual da agricultura de santa catarina 1995 - Cepa
- No tags were found...

You also want an ePaper? Increase the reach of your titles
YUMPU automatically turns print PDFs into web optimized ePapers that Google loves.
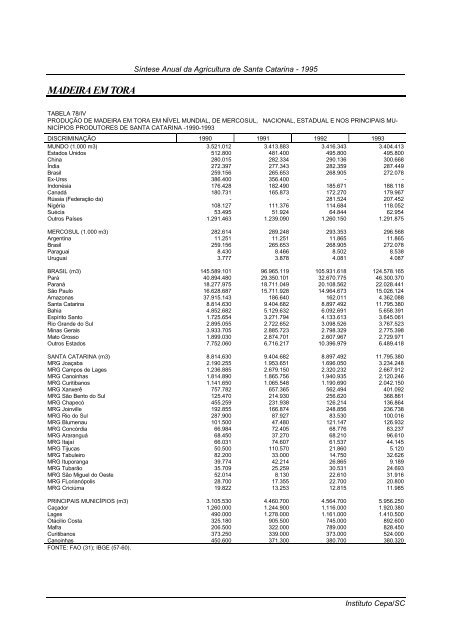
MADEIRA EM TORASíntese Anual <strong>da</strong> Agricultura <strong>de</strong> Santa Catarina - <strong>1995</strong>TABELA 78/IVPRODUÇÃO DE MADEIRA EM TORA EM NÍVEL MUNDIAL, DE MERCOSUL, NACIONAL, ESTADUAL E NOS PRINCIPAIS MU-NICÍPIOS PRODUTORES DE SANTA CATARINA -1990-1993DISCRIMINAÇÃO 1990 1991 1992 1993MUNDO (1.000 m3) 3.521.012 3.413.883 3.416.343 3.404.413Estados Unidos 512.800 481.400 495.800 495.800China 280.015 282.334 290.136 300.668Índia 272.397 277.343 282.359 287.449Brasil 259.156 265.653 268.905 272.078Ex-Urss 386.400 356.400 - -Indonésia 176.428 182.490 185.671 188.118Canadá 180.731 165.873 172.270 179.967Rússia (Fe<strong>de</strong>ração <strong>da</strong>) - - 281.524 207.452Nigéria 108.127 111.376 114.684 118.052Suécia 53.495 51.924 64.844 62.954Outros Países 1.291.463 1.239.090 1.260.150 1.291.875MERCOSUL (1.000 m3) 282.614 289.248 293.353 296.568Argentina 11.251 11.251 11.865 11.865Brasil 259.156 265.653 268.905 272.078Paraguai 8.430 8.466 8.502 8.538Uruguai 3.777 3.878 4.081 4.087BRASIL (m3) 145.589.101 96.965.119 105.931.618 124.578.165Pará 40.894.480 29.350.101 32.670.775 46.300.370Paraná 18.277.975 18.711.049 20.108.562 22.028.441São Paulo 16.628.687 15.711.928 14.964.673 15.026.124Amazonas 37.915.143 186.640 162.011 4.362.088Santa Catarina 8.814.630 9.404.682 8.897.492 11.795.380Bahia 4.852.682 5.129.632 6.092.691 5.658.391Espírito Santo 1.725.654 3.271.794 4.133.613 3.645.061Rio Gran<strong>de</strong> do Sul 2.895.055 2.722.652 3.098.526 3.767.523Minas Gerais 3.933.705 2.885.723 2.798.329 2.775.398Mato Grosso 1.899.030 2.874.701 2.607.967 2.729.971Outros Estados 7.752.060 6.716.217 10.396.979 6.489.418SANTA CATARINA (m3) 8.814.630 9.404.682 8.897.492 11.795.380MRG Joaçaba 2.190.255 1.953.651 1.696.050 3.234.248MRG Campos <strong>de</strong> Lages 1.236.885 2.679.150 2.320.232 2.667.912MRG Canoinhas 1.814.890 1.865.756 1.940.935 2.120.246MRG Curitibanos 1.141.650 1.065.548 1.190.690 2.042.150MRG Xanxerê 757.782 657.365 562.494 401.092MRG São Bento do Sul 125.470 214.930 256.620 368.861MRG Chapecó 455.259 231.938 126.214 136.864MRG Joinville 192.855 166.874 248.856 236.738MRG Rio do Sul 287.900 87.927 83.530 100.016MRG Blumenau 101.500 47.480 121.147 126.932MRG Concórdia 66.984 72.405 68.776 83.237MRG Araranguá 68.450 37.270 68.210 96.610MRG Itajaí 66.031 74.607 61.537 44.145MRG Tijucas 50.500 110.570 21.860 5.120MRG Tabuleiro 82.200 33.000 14.750 32.626MRG Ituporanga 39.774 42.214 26.865 9.189MRG Tubarão 35.709 25.259 30.531 24.693MRG São Miguel do Oeste 52.014 8.130 22.610 31.916MRG FLorianópolis 28.700 17.355 22.700 20.800MRG Criciúma 19.822 13.253 12.815 11.985PRINCIPAIS MUNICÍPIOS (m3) 3.105.530 4.460.700 4.564.700 5.956.250Caçador 1.260.000 1.244.900 1.116.000 1.920.380Lages 490.000 1.278.000 1.161.000 1.410.500Otácilio Costa 325.180 905.500 745.000 892.600Mafra 206.500 322.000 789.000 828.450Curitibanos 373.250 339.000 373.000 524.000Canoinhas 450.600 371.300 380.700 380.320FONTE: FAO (31); IBGE (57-60).Instituto <strong>Cepa</strong>/SC


