

sÃntese anual da agricultura de santa catarina 1995 - Cepa
sÃntese anual da agricultura de santa catarina 1995 - Cepa
sÃntese anual da agricultura de santa catarina 1995 - Cepa
- No tags were found...

You also want an ePaper? Increase the reach of your titles
YUMPU automatically turns print PDFs into web optimized ePapers that Google loves.
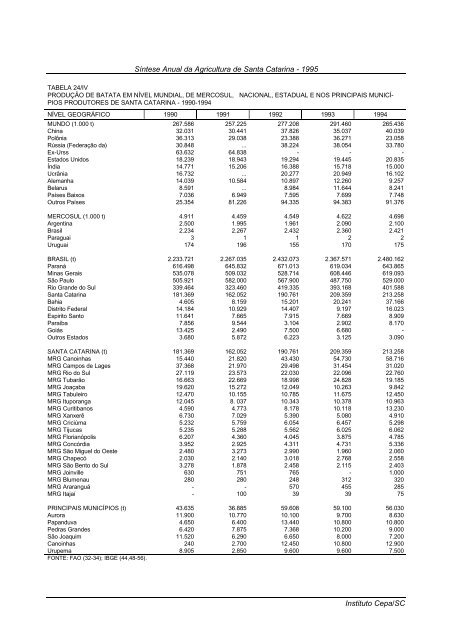
Síntese Anual <strong>da</strong> Agricultura <strong>de</strong> Santa Catarina - <strong>1995</strong>TABELA 24/IVPRODUÇÃO DE BATATA EM NÍVEL MUNDIAL, DE MERCOSUL, NACIONAL, ESTADUAL E NOS PRINCIPAIS MUNICÍ-PIOS PRODUTORES DE SANTA CATARINA - 1990-1994NÍVEL GEOGRÁFICO 1990 1991 1992 1993 1994MUNDO (1.000 t) 267.586 257.225 277.208 291.460 265.436China 32.031 30.441 37.826 35.037 40.039Polônia 36.313 29.038 23.388 36.271 23.058Rússia (Fe<strong>de</strong>ração <strong>da</strong>) 30.848 ... 38.224 38.054 33.780Ex-Urss 63.632 64.838 - - -Estados Unidos 18.239 18.943 19.294 19.445 20.835Índia 14.771 15.206 16.388 15.718 15.000Ucrânia 16.732 ... 20.277 20.949 16.102Alemanha 14.039 10.584 10.897 12.260 9.257Belarus 8.591 ... 8.984 11.644 8.241Países Baixos 7.036 6.949 7.595 7.699 7.748Outros Países 25.354 81.226 94.335 94.383 91.376MERCOSUL (1.000 t) 4.911 4.459 4.549 4.622 4.698Argentina 2.500 1.995 1.961 2.090 2.100Brasil 2.234 2.267 2.432 2.360 2.421Paraguai 3 1 1 2 2Uruguai 174 196 155 170 175BRASIL (t) 2.233.721 2.267.035 2.432.073 2.367.571 2.480.162Paraná 616.498 645.832 671.013 619.034 643.865Minas Gerais 535.078 509.032 528.714 608.446 619.093São Paulo 505.921 582.000 567.900 487.750 529.000Rio Gran<strong>de</strong> do Sul 339.464 323.460 419.335 393.168 401.588Santa Catarina 181.369 162.052 190.761 209.359 213.258Bahia 4.605 8.159 15.201 20.241 37.166Distrito Fe<strong>de</strong>ral 14.184 10.929 14.407 9.197 16.023Espirito Santo 11.641 7.665 7.915 7.669 8.909Paraíba 7.856 9.544 3.104 2.902 8.170Goiás 13.425 2.490 7.500 6.680 -Outros Estados 3.680 5.872 6.223 3.125 3.090SANTA CATARINA (t) 181.369 162.052 190.761 209.359 213.258MRG Canoinhas 15.440 21.820 43.430 54.730 58.716MRG Campos <strong>de</strong> Lages 37.368 21.970 29.498 31.454 31.020MRG Rio do Sul 27.119 23.573 22.030 22.096 22.760MRG Tubarão 16.663 22.669 18.998 24.828 19.185MRG Joaçaba 19.620 15.272 12.049 10.263 9.842MRG Tabuleiro 12.470 10.155 10.785 11.675 12.450MRG Ituporanga 12.045 8. 037 10.343 10.378 10.963MRG Curitibanos 4.590 4.773 8.178 10.118 13.230MRG Xanxerê 6.730 7.029 5.390 5.080 4.910MRG Criciúma 5.232 5.759 6.054 6.457 5.298MRG Tijucas 5.235 5.288 5.562 6.025 6.062MRG Florianópolis 6.207 4.360 4.045 3.875 4.785MRG Concórdia 3.952 2.925 4.311 4.731 5.336MRG São Miguel do Oeste 2.480 3.273 2.990 1.960 2.060MRG Chapecó 2.030 2.140 3.018 2.768 2.558MRG São Bento do Sul 3.278 1.878 2.458 2.115 2.403MRG Joinville 630 751 765 - 1.000MRG Blumenau 280 280 248 312 320MRG Araranguá - - 570 455 285MRG Itajaí - 100 39 39 75PRINCIPAIS MUNICÍPIOS (t) 43.635 36.885 59.608 59.100 56.030Aurora 11.900 10.770 10.100 9.700 8.630Papanduva 4.650 6.400 13.440 10.800 10.800Pedras Gran<strong>de</strong>s 6.420 7.875 7.368 10.200 9.000São Joaquim 11.520 6.290 6.650 8.000 7.200Canoinhas 240 2.700 12.450 10.800 12.900Urupema 8.905 2.850 9.600 9.600 7.500FONTE: FAO (32-34); IBGE (44,48-56).Instituto <strong>Cepa</strong>/SC


