Síntese Anual <strong>da</strong> Agricultura <strong>de</strong> Santa Catarina - <strong>1995</strong>TABELA 12/IVPREÇOS MÍNIMOS VIGENTES NA REGIÃO CENTRO-SUL - 1992-<strong>1995</strong>ANO/MÊSARROZ-DE-SEQUEIRO(sc 60 kg)ARROZIRRIGADO(sc 50 kg)FEIJÃO(sc 60 kg)MANDIOCA(t)MILHO(sc 60 kg)SOJA(sc 60 kg)(US$)TRIGO(¹)(t)1992 Jan 2,11 2,29 22,72 23,18 1,52 1,81 102,92Fev 7,36 8,34 23,09 23,56 5,54 6,77 104,57Mar 7,53 8,53 23,63 24,11 5,67 6,93 85,22Abr 7,73 8,76 24,26 24,75 5,82 7,11 70,39Mai 7,82 8,86 24,55 25,04 5,89 7,20 58,83Jun 7,82 8,86 24,54 25,04 5,89 7,19 49,09Jul 7,79 8,82 24,44 24,93 5,86 7,16 40,38Ago 6,38 7,23 24,77 25,27 5,94 5,87 135,45Set 5,17 5,85 24,71 25,21 5,93 4,75 135,11Out 4,13 4,68 24,78 25,28 5,94 3,80 135,51Nov 3,30 3,73 22,25 25,22 4,74 3,03 135,16Dez 2,67 3,03 22,25 25,23 3,85 2,46 135,201993 Jan 2,12 2,40 21,88 22,32 3,05 1,95 132,92Fev 7,73 8,75 21,82 22,26 5,52 7,11 132,56Mar 7,77 8,80 21,93 22,38 5,55 7,14 105,42Abr 7,64 8,66 19,42 22,02 5,46 7,03 82,45Mai 7,60 8,61 19,32 21,90 5,43 6,99 63,95Jun 7,53 8,53 19,14 21,70 5,38 6,93 49,24Jul 7,51 8,50 19,08 21,63 5,37 6,90 37,73Ago 5,69 6,45 18,86 21,27 4,07 5,24 119,89Set 4,24 4,80 18,71 21,14 3,03 3,90 118,90Out 3,12 3,53 18,53 20,96 2,23 2,86 117,77Nov 2,29 2,59 18,59 21,04 1,64 2,10 118,12Dez 1,69 1,91 18,65 21,12 1,20 1,55 118,511994 Jan 1ª(²) 1,21 1,37 18,23 20,65 0,86 1,11 115,882ª 1,21 1,37 21,51 24,38 0,86 1,11 136,70Fev 1ª 7,20 8,16 18,30 20,73 5,15 6,62 116,302ª 8,52 9,65 21,64 24,53 6,09 7,83 137,56Mar 1ª 7,22 8,18 18,35 20,80 5,16 6,64 123,872ª 8,60 9,74 21,86 24,77 6,15 7,91 147,53Abr 1ª 7,09 8,03 18,02 20,43 5,07 6,52 121,642ª 8,65 9,80 21,99 24,93 6,19 7,96 159,84Mai 1ª 7,24 8,21 18,41 20,87 5,18 6,66 124,262ª 8,62 9,76 21,90 24,82 6,16 7,92 147,79Jun 1ª 7,32 8,30 18,62 21,10 5,24 6,74 125,642ª 8,81 9,98 22,38 25,35 6,30 8,10 151,05Jul 9,49 10,74 24,12 27,33 6,77 8,72 162,75Ago 9,84 11,15 25,03 28,36 7,03 9,05 168,91Set 10,23 11,58 26,01 29,48 7,31 9,41 175,55Out 10,46 11,84 26,60 30,14 7,47 9,62 179,49Nov 10,51 11,90 26,72 30,29 7,51 9,67 180,34Dez 10,41 11,79 26,47 30,00 7,44 9,58 178,65<strong>1995</strong> Jan 10,45 11,83 26,56 30,11 7,46 9,61 179,28Fev 10,52 11,91 26,75 30,32 7,51 9,68 180,56Mar 9,96 11,27 25,31 28,68 7,11 9,16 170,81Abr 9,75 11,04 24,78 28,08 6,96 8,96 167,24Mai 9,87 11,17 25,08 28,43 7,05 9,07 169,29Jun 9,68 10,96 24,62 27,90 6,91 8,91 166,14Jul 9,53 10,79 24,22 27,45 6,80 8,76 163,46Ago 9,39 10,64 23,89 27,07 6,71 8,64 132,70Set 9,29 10,51 23,61 26,76 6,63 8,54 131,16Out 9,22 10,44 23,44 26,56 6,58 8,48 130,21Nov 9,18 10,39 24,90 26,45 6,56 8,44 129,67Dez 9,14 10,35 24,79 26,34 6,53 8,41 129,13FONTE: Conab.(¹) A partir <strong>de</strong> 1994 refere-se a trigo <strong>de</strong> PH 78 classe comum/intermediário.(²) De jan-jun/94 <strong>da</strong>dos por quinzena.Nota: De 15 jan/89 a 14 mar/90 = Cruzado Novo; <strong>de</strong> 15 mar/90 a 31 jul/93 = Cruzeiro; <strong>de</strong> 01 ago/93 a 30 jun/94 = Cruzeiro Real; a partir<strong>de</strong> 01 jul/94 = Real.Instituto <strong>Cepa</strong>/SC
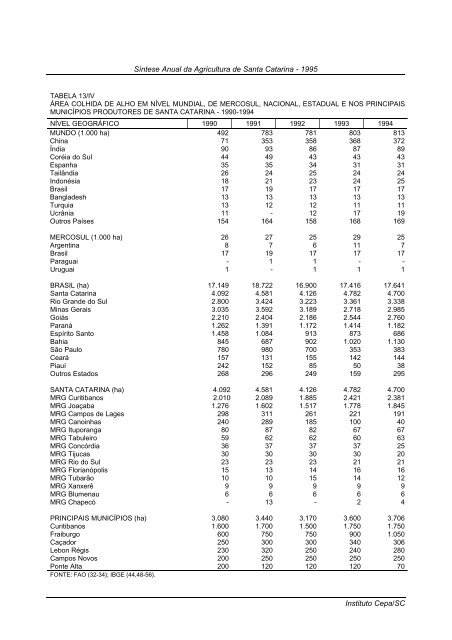
Síntese Anual <strong>da</strong> Agricultura <strong>de</strong> Santa Catarina - <strong>1995</strong>TABELA 13/IVÁREA COLHIDA DE ALHO EM NÍVEL MUNDIAL, DE MERCOSUL, NACIONAL, ESTADUAL E NOS PRINCIPAISMUNICÍPIOS PRODUTORES DE SANTA CATARINA - 1990-1994NÍVEL GEOGRÁFICO 1990 1991 1992 1993 1994MUNDO (1.000 ha) 492 783 781 803 813China 71 353 358 368 372Índia 90 93 86 87 89Coréia do Sul 44 49 43 43 43Espanha 35 35 34 31 31Tailândia 26 24 25 24 24Indonésia 18 21 23 24 25Brasil 17 19 17 17 17Bangla<strong>de</strong>sh 13 13 13 13 13Turquia 13 12 12 11 11Ucrânia 11 - 12 17 19Outros Países 154 164 158 168 169MERCOSUL (1.000 ha) 26 27 25 29 25Argentina 8 7 6 11 7Brasil 17 19 17 17 17Paraguai - 1 1 - -Uruguai 1 - 1 1 1BRASIL (ha) 17.149 18.722 16.900 17.416 17.641Santa Catarina 4.092 4.581 4.126 4.782 4.700Rio Gran<strong>de</strong> do Sul 2.800 3.424 3.223 3.361 3.338Minas Gerais 3.035 3.592 3.189 2.718 2.985Goiás 2.210 2.404 2.186 2.544 2.760Paraná 1.262 1.391 1.172 1.414 1.182Espírito Santo 1.458 1.084 913 873 686Bahia 845 687 902 1.020 1.130São Paulo 780 980 700 353 383Ceará 157 131 155 142 144Piauí 242 152 85 50 38Outros Estados 268 296 249 159 295SANTA CATARINA (ha) 4.0922 4.581 4.126 4.782 4.700MRG Curitibanos 2.0100 2.089 1.885 2.421 2.381MRG Joaçaba 1.276 1.602 1.517 1.778 1.845MRG Campos <strong>de</strong> Lages 298 311 261 221 191MRG Canoinhas 240 289 185 100 40MRG Ituporanga 80 87 82 67 67MRG Tabuleiro 59 62 62 60 63MRG Concórdia 36 37 37 37 25MRG Tijucas 30 30 30 30 20MRG Rio do Sul 23 23 23 21 21MRG Florianópolis 15 13 14 16 16MRG Tubarão 10 10 15 14 12MRG Xanxerê 9 9 9 9 9MRG Blumenau 6 6 6 6 6MRG Chapecó - 13 - 2 4PRINCIPAIS MUNICÍPIOS (ha) 3.080 3.440 3.170 3.600 3.706Curitibanos 1.600 1.700 1.500 1.750 1.750Fraiburgo 600 750 750 900 1.050Caçador 250 300 300 340 306Lebon Régis 230 320 250 240 280Campos Novos 200 250 250 250 250Ponte Alta 200 120 120 120 70FONTE: FAO (32-34); IBGE (44,48-56).Instituto <strong>Cepa</strong>/SC