- Page 1 and 2:
25th Inter
- Page 3 and 4:
Dear Conference Delegates, Preface
- Page 5 and 6:
Monday 19 th September 2011 - Morni
- Page 7 and 8:
Monday 19 th September 2011 - After
- Page 9 and 10:
Tuesday 20 th September 2011 - Afte
- Page 11 and 12:
Wednesday 21 st September 2011 - Mo
- Page 13 and 14:
Wednesday 21 st September 2011 - Af
- Page 15 and 16:
13.40 - 15.05 Poster Session 4 (In
- Page 17 and 18:
Friday 23 rd September 2011 - Morni
- Page 19 and 20:
Poster Sessions (in Kongress-Saal)
- Page 21 and 22:
P-026 Comparison of comprehensive t
- Page 23 and 24:
P-052 Incorporation of Archaeal and
- Page 25 and 26:
P-081 Geochemical evidence for two
- Page 27 and 28:
P-108 Organic geochemistry and Meso
- Page 29 and 30:
P-133 Can we estimate catchment-sca
- Page 31 and 32:
P-157 Can laterally advected interm
- Page 33 and 34:
P-182 The influence of hydrogen on
- Page 35 and 36:
P-207 Biomarkers along a holocene s
- Page 37 and 38:
P-232 Some experimental results on
- Page 39 and 40:
P-261 Natural gas generation, migra
- Page 41 and 42:
P-288 Re/Os fractionation during ge
- Page 43 and 44:
P-314 Chemometric analysis of oil-o
- Page 45 and 46:
P-340 Atypical fluids in offshore s
- Page 47 and 48:
P-366 Organic geochemical character
- Page 49 and 50:
P-392 Environmental forensic study
- Page 51 and 52:
P-416 Developing analytical protoco
- Page 53 and 54:
P-442 Deep-sea benthic archaea recy
- Page 55 and 56:
P-464 Effects of within-catchment p
- Page 57 and 58:
Poster Session 4 - Thursday 22 nd S
- Page 59 and 60:
Monday Oral Presentations 58
- Page 61 and 62:
O-02 Melting history of West Antarc
- Page 63 and 64:
O-04 Insights about the marine nitr
- Page 65 and 66:
O-06 Eocene out-of-India dispersal
- Page 67 and 68:
O-08 An integrated lipid biomarker
- Page 69 and 70:
O-10 Sulfur species as facilitators
- Page 71 and 72:
O-12 Sulfur isotope systematic of i
- Page 73 and 74:
O-14 Exploring the diversity of arc
- Page 75 and 76:
O-16 Improved genetic characterizat
- Page 77 and 78:
O-18 Petroleum system analysis Sout
- Page 79 and 80:
O-19 The borolithochromes: boron-co
- Page 81 and 82:
O-21 Study of the stable isotopic c
- Page 83 and 84:
O-23 Novel applications of trace me
- Page 85 and 86:
O-25 The chemical structure of inso
- Page 87 and 88:
O-27 Coenzyme factor 430: abundance
- Page 89 and 90:
O-29 Influence of temperature on me
- Page 91 and 92:
O-31 The fate of collembola derived
- Page 93 and 94:
O-33 Empirical relationship between
- Page 95 and 96:
O-35 Biomarker evidence for the Lat
- Page 97 and 98:
O-37 The seco-oleananes: identifica
- Page 99 and 100:
O-38 Microbial communities associat
- Page 101 and 102:
O-40 The importance of geochemical
- Page 103 and 104:
O-42 Charge history and petroleum g
- Page 105 and 106:
O-44 Bacterial formation of (di)eth
- Page 107 and 108:
O-46 Development of a novel tool fo
- Page 109 and 110:
O-48 Evolution of petroleum composi
- Page 111 and 112:
O-50 Beyond Orgas- BP’s new predi
- Page 113 and 114:
O-52 Nitrogen isotopes of amino aci
- Page 115 and 116:
O-54 Biomarker and petrographic evi
- Page 117 and 118:
O-55 The organic geochemistry of ca
- Page 119 and 120:
O-57 Exploring mass extinction even
- Page 121 and 122:
O-59 Black shale formation by micro
- Page 123 and 124:
O-61 The significant impact of weat
- Page 125 and 126:
O-63 Simultaneous shifts in tempera
- Page 127 and 128: O-65 Fluxes and isotope composition
- Page 129 and 130: O-67 Biogeochemical impact of CO2 e
- Page 131 and 132: Bacteria number ml-1 Bacteria numbe
- Page 133 and 134: O-71 Aquathermolysis: pressure effe
- Page 135 and 136: O-73 Designing tight-shale producti
- Page 137 and 138: O-74 Tracing 13C-labeled inorganic
- Page 139 and 140: O-76 Carbon fluxes in phylogenetica
- Page 141 and 142: O-78 Fluid property prediction from
- Page 143 and 144: O-80 Denitrifying bacteria as poten
- Page 145 and 146: O-82 Tetraether lipid profiles in c
- Page 147 and 148: O-84 Prediction of gas volume and d
- Page 149 and 150: Monday Poster Presentations 148
- Page 151 and 152: P-002 Structure and function of asp
- Page 153 and 154: P-004 Preliminary study of acid deg
- Page 155 and 156: P-006 Chemical and geochemical char
- Page 157 and 158: P-008 High resolution measurement o
- Page 159 and 160: P-010 Acidic fraction analyses of B
- Page 161 and 162: P-012 Heteroatom-containing compoun
- Page 163 and 164: P-014 Evaluation of hydropyrolysis
- Page 165 and 166: P-016 Iron isotopic compositions of
- Page 167 and 168: P-018 Evaluation of accelerated sol
- Page 169 and 170: P-020 Improvement of HPLC-protocols
- Page 171 and 172: P-022 Open-system hydrous pyrolysis
- Page 173 and 174: P-024 The phenolic characterisation
- Page 175 and 176: P-026 Comparison of comprehensive t
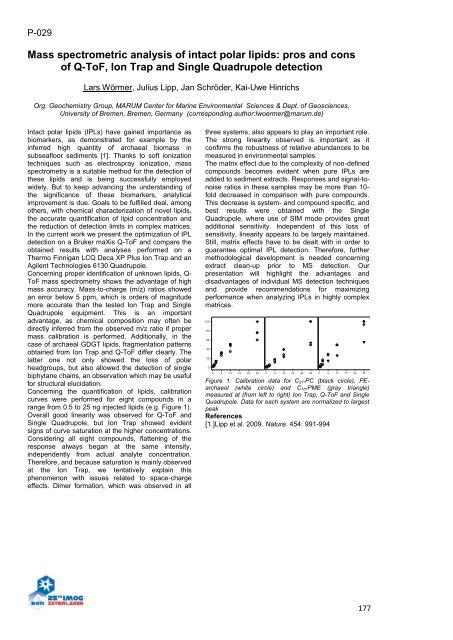
- Page 177: P-028 Characterisation of lignin de
- Page 181 and 182: P-033 An evaluation of petroleum so
- Page 183 and 184: P-035 Contrasting macromolecular or
- Page 185 and 186: P-037 Evolution of depositional env
- Page 187 and 188: P-039 Organic carbon content and ch
- Page 189 and 190: P-041 Organic geochemistry of entra
- Page 191 and 192: P-043 Petrological and organic geoc
- Page 193 and 194: P-045 Occurrence and geochemical ch
- Page 195 and 196: P-047 Characterization of lignites
- Page 197 and 198: P-049 Organic matter of Lower Permi
- Page 199 and 200: P-051 Kerogen sulphur, hydrogen and
- Page 201 and 202: P-053 Sulfur-bound compounds in fre
- Page 203 and 204: P-055 Organic matter preservation i
- Page 205 and 206: P-058 Characterization of aromatic
- Page 207 and 208: P-060 Biomarkers parameters used to
- Page 209 and 210: P-063 Origin of crude oil with high
- Page 211 and 212: P-065 Molecular maturation of Bitum
- Page 213 and 214: P-067 C21-C23 steroidal tricyclic t
- Page 215 and 216: P-069 The age and palaeoenvironment
- Page 217 and 218: P-071 Structural characterization o
- Page 219 and 220: P-074 Discussion on appliance of 25
- Page 221 and 222: P-076 Lanostanes as the new biomark
- Page 223 and 224: P-079 Geochemistry of ―just gener
- Page 225 and 226: P-081 Geochemical evidence for two
- Page 227 and 228: P-083 Thermal maturity assessment o
- Page 229 and 230:
P-085 Flash pyrolysis-gas chromatog
- Page 231 and 232:
P-087 Petroleum geochemistry of the
- Page 233 and 234:
P-089 Addressing thermogenic and bi
- Page 235 and 236:
P-091 Investigation of oil stabilit
- Page 237 and 238:
P-093 Organic geochemistry, petrole
- Page 239 and 240:
P-095 Natural petroleum fractionati
- Page 241 and 242:
P-097 Geochemistry of low-boiling
- Page 243 and 244:
P-099 Oxygen-containing compounds i
- Page 245 and 246:
P-101 Formation of giant deep-burie
- Page 247 and 248:
P-103 Geochemical characteristics o
- Page 249 and 250:
P-105 Challenges on the origin of o
- Page 251 and 252:
P-107 Caldera of the Uzon volcano a
- Page 253 and 254:
P-109 A saga on organic geochemistr
- Page 255 and 256:
P-111 An integrated inorganic and o
- Page 257 and 258:
P-114 Hydrocarbon generation potent
- Page 259 and 260:
P-116 Marine transgressional event
- Page 261 and 262:
P-118 The cracking kinetics of two
- Page 263 and 264:
P-120 The generation potential of t
- Page 265 and 266:
P-122 Organic geochemical character
- Page 267 and 268:
P-124 Compositional features of org
- Page 269 and 270:
P-126 The value of generation hydro
- Page 271 and 272:
P-128 Investigation of fish pond ma
- Page 273 and 274:
P-130 Bituminous mixtures of Hakemi
- Page 275 and 276:
P-132 Combined � 13 C - �D anal
- Page 277 and 278:
P-134 Biomarkers preserved in cave
- Page 279 and 280:
P-136 Analysis of insoluble organic
- Page 281 and 282:
P-139 Role and nature of organic ma
- Page 283 and 284:
P-141 Biosurfactants - a green alte
- Page 285 and 286:
P-143 Phenolic compounds in water l
- Page 287 and 288:
P-145 Current level of the organic
- Page 289 and 290:
P-147 The d13C composition of indiv
- Page 291 and 292:
P-149 Targeted chemical and physica
- Page 293 and 294:
P-151 Cu(II) complexation with humi
- Page 295 and 296:
P-153 Differentiation of indoor and
- Page 297 and 298:
P-156 A detailed study of the intac
- Page 299 and 300:
P-158 Unusual distribution of long-
- Page 301 and 302:
P-160 Biomarker signatures of metha
- Page 303 and 304:
P-162 Lipid biomarkers and bulk bio
- Page 305 and 306:
P-164 Chemotaxonomic composition an
- Page 307 and 308:
P-166 The role of two submarine can
- Page 309 and 310:
P-168 Correlation of crenarchaea an
- Page 311 and 312:
P-170 Microbial activity and abunda
- Page 313 and 314:
P-172 Microbially mediated carbonat
- Page 315 and 316:
P-174 Distinct microbial inventorie
- Page 317 and 318:
P-176 Microbial consortium mediatin
- Page 319 and 320:
P-178 Diversity of microbial commun
- Page 321 and 322:
P-180 Inhibition of anaerobic oil d
- Page 323 and 324:
P-182 The influence of hydrogen on
- Page 325 and 326:
P-184 Have they lost their heads? D
- Page 327 and 328:
P-187 Paleohydrological changes on
- Page 329 and 330:
P-189 Paleoenvironmental variations
- Page 331 and 332:
P-191 Highly branched isoprenoid al
- Page 333 and 334:
P-193 A new global calibration for
- Page 335 and 336:
P-195 Molecular fossils and the lat
- Page 337 and 338:
P-197 Sediment trap and core top st
- Page 339 and 340:
P-199 Detection of environmental ch
- Page 341 and 342:
P-201 Carbon and hydrogen isotope b
- Page 343 and 344:
P-203 Biogeochemical processes in H
- Page 345 and 346:
P-205 Lipid biomarker analysis of f
- Page 347 and 348:
P-207 Biomarkers along a holocene s
- Page 349 and 350:
P-209 A comparison of methane emiss
- Page 351 and 352:
P-211 Paleocene-Eocene Thermal Maxi
- Page 353 and 354:
P-213 Biomarker proxies indicate si
- Page 355 and 356:
P-215 Distributions of long-chain d
- Page 357 and 358:
P-217 The Vinylguaiacol/Indole or V
- Page 359 and 360:
P-219 The age and palaeoenvironment
- Page 361 and 362:
P-221 Differences in distribution o
- Page 363 and 364:
P-225 The change of land plant deri
- Page 365 and 366:
P-227 Terrestrial organic matter in
- Page 367 and 368:
P-229 Geochemical peculiarities of
- Page 369 and 370:
P-231 Bacteriohopanepolyol content
- Page 371 and 372:
P-233 Branched GDGTs in the Yenisei
- Page 373 and 374:
P-235 Simulation of organic matter
- Page 375 and 376:
P-237 Nature of C29 sterols in the
- Page 377 and 378:
P-239 Differentiation of organic ma
- Page 379 and 380:
P-242 Changes of Rock-Eval HI, OI,
- Page 381 and 382:
P-244 Identification and distributi
- Page 383 and 384:
P-246 Carbon isotopes and lipid bio
- Page 385 and 386:
P-248 Comparison of soil organic ma
- Page 387 and 388:
P-250 Biomarker distribution along
- Page 389 and 390:
Wednesday Poster Presentations 388
- Page 391 and 392:
P-255 Gas source classification in
- Page 393 and 394:
P-257 The components and carbon iso
- Page 395 and 396:
P-259 Stable carbon isotopes of coa
- Page 397 and 398:
P-261 Natural gas generation, migra
- Page 399 and 400:
P-264 Natural gas geochemistry of t
- Page 401 and 402:
P-266 Geochemical and isotopic char
- Page 403 and 404:
P-269 Distribution of alkylbenzenes
- Page 405 and 406:
P-271 Terrestrial-derived biomarker
- Page 407 and 408:
P-273 Preservation of β-carotane i
- Page 409 and 410:
P-275 Aromatic hydrocarbons in oils
- Page 411 and 412:
P-277 Statistical analysis of diamo
- Page 413 and 414:
P-279 Characterization of biomarker
- Page 415 and 416:
P-281 The significance of novel A-n
- Page 417 and 418:
P-283 Correlation between compositi
- Page 419 and 420:
P-285 Understanding Fluid Inclusion
- Page 421 and 422:
P-287 The hydrocarbon occurrence an
- Page 423 and 424:
P-289 Correlation of crude oils res
- Page 425 and 426:
P-291 Geochemical parameters for un
- Page 427 and 428:
P-293 Hydrocarbon biomarkers in the
- Page 429 and 430:
P-295 Using diamondoids to unravel
- Page 431 and 432:
P-297 Significance of aromatic biom
- Page 433 and 434:
P-299 Drilling conditions making we
- Page 435 and 436:
P-301 Biomarker distributions and
- Page 437 and 438:
P-303 Evaluation of petroleum syste
- Page 439 and 440:
P-305 Geochemical indices of hydroc
- Page 441 and 442:
P-307 Basin modelling of the Hammer
- Page 443 and 444:
P-309 Comparative characteristics o
- Page 445 and 446:
P-311 High water pressure induced c
- Page 447 and 448:
P-313 Calibration of absolute matur
- Page 449 and 450:
P-315 Organic Geochemistry of Lower
- Page 451 and 452:
P-317 Laboratory simulation of vert
- Page 453 and 454:
P-319 The study of C1-C3 gas genera
- Page 455 and 456:
P-321 Hydrocarbon potential of Maik
- Page 457 and 458:
P-323 Paleoenvironment significance
- Page 459 and 460:
P-325 Origin of abnormal sonic resp
- Page 461 and 462:
P-327 Organic geochemistry and orga
- Page 463 and 464:
P-329 Characterising the deposition
- Page 465 and 466:
P-331 Organic-geochemical character
- Page 467 and 468:
P-335 Geochemistry of aqua-bitumoid
- Page 469 and 470:
P-337 Application of electrospray i
- Page 471 and 472:
P-339 Geochemical characterization
- Page 473 and 474:
P-341 Simulation studies on the ads
- Page 475 and 476:
P-343 Effective diffusivities of CO
- Page 477 and 478:
P-345 Oil Fingerprinting associated
- Page 479 and 480:
P-347 Strategies for the assessment
- Page 481 and 482:
P-349 Fluid pressure evolution and
- Page 483 and 484:
P-351 The releasing of covalently-b
- Page 485 and 486:
P-354 Sulfur isotope fractionation
- Page 487 and 488:
P-356 Controls on the kinetics of t
- Page 489 and 490:
P-358 Sulfur compounds in liquid pr
- Page 491 and 492:
P-360 High pressure pyrolysis of hy
- Page 493 and 494:
P-362 The reaction of elemental sul
- Page 495 and 496:
P-365 Geochemical evaluation of the
- Page 497 and 498:
P-367 Geochemical controls on shale
- Page 499 and 500:
P-369 Evolution of pores in organic
- Page 501 and 502:
P-371 Preliminary investigations in
- Page 503 and 504:
P-373 Geochemistry of coalbed metha
- Page 505 and 506:
P-375 Integration of basin modeling
- Page 507 and 508:
P-377 Oil shales occurring in Mongo
- Page 509 and 510:
Thursday Poster Presentations 508
- Page 511 and 512:
P-381 Permissible concentration of
- Page 513 and 514:
P-383 Accumulation and degradation
- Page 515 and 516:
P-385 Source determination and dept
- Page 517 and 518:
P-387 The use of phospholipid fatty
- Page 519 and 520:
P-389 Biogeochemical process studie
- Page 521 and 522:
P-391 Environmental forensics-recen
- Page 523 and 524:
P-393 Geochemical characterization
- Page 525 and 526:
P-395 Source characterization using
- Page 527 and 528:
P-397 Impact of different operating
- Page 529 and 530:
P-399 Resolving sources and preserv
- Page 531 and 532:
P-402 New insights into soil organi
- Page 533 and 534:
P-404 Amino sugars as biomarkers fo
- Page 535 and 536:
P-406 Biogeochemistry of lake Soppe
- Page 537 and 538:
P-408 Sea surface salinity reconstr
- Page 539 and 540:
P-410 Carbon cycling in lacustrine
- Page 541 and 542:
P-412 Radiocarbon distributions in
- Page 543 and 544:
P-414 European lake sediment calibr
- Page 545 and 546:
P-416 Developing analytical protoco
- Page 547 and 548:
P-418 Extreme intra- and intermolec
- Page 549 and 550:
P-420 � 2 H differences among lip
- Page 551 and 552:
P-424 Intact polar lipid and associ
- Page 553 and 554:
P-426 Bacterial versus archaeal act
- Page 555 and 556:
P-428 Study of microbial activity a
- Page 557 and 558:
P-430 New bacteriochlorophyll degra
- Page 559 and 560:
P-432 Thermally stable anammox biom
- Page 561 and 562:
P-434 Impact of a high CO2 partial
- Page 563 and 564:
P-436 Methane oxidation in the wate
- Page 565 and 566:
P-438 Lipid biomarkers of archaeal
- Page 567 and 568:
P-440 Estimation of endospore numbe
- Page 569 and 570:
P-442 Deep-sea benthic archaea recy
- Page 571 and 572:
P-444 Isolating and cultivating env
- Page 573 and 574:
P-446 Distribution of ammonia-oxidi
- Page 575 and 576:
P-448 Genetic and metabolic charact
- Page 577 and 578:
P-450 Proxies based on archaeal and
- Page 579 and 580:
P-453 Experimental palaeochemotaxon
- Page 581 and 582:
P-455 Long term cooling and punctua
- Page 583 and 584:
P-457 Molecular and isotopic eviden
- Page 585 and 586:
P-459 Long-term variations of palae
- Page 587 and 588:
P-461 Miocene to Pliocene environme
- Page 589 and 590:
P-463 Holocene paleoclimatic variat
- Page 591 and 592:
P-465 Hydrological and biogeochemic
- Page 593 and 594:
P-467 Molecular hydrogen isotope sy
- Page 595 and 596:
P-469 Impact of anaerobic methane o
- Page 597 and 598:
P-471 Integrating biomarker and mic
- Page 599 and 600:
P-473 Application of TEX86-paleothe
- Page 601 and 602:
P-475 Stable isotopes (C, S) and hy
- Page 603 and 604:
P-478 The first findings of 12- and
- Page 605 and 606:
P-480 The 3 P’s* and the Albian o
- Page 607 and 608:
P-482 Meter-scale oxygen gradients
- Page 609 and 610:
P-484 Coupling of Miocene-Pliocene
- Page 611 and 612:
P-486 New molecular marker and spec
- Page 613 and 614:
P-488 Paleoenvironmental changes fr
- Page 615 and 616:
P-491 Methoxy-serratenes as discrim
- Page 617 and 618:
P-493 Vegetation and soil organic m
- Page 619 and 620:
P-497 Decomposition of wheat straw
- Page 621 and 622:
P-499 The relationship between peat
- Page 623 and 624:
P-501 Land use and climatic effects
- Page 625 and 626:
P-503 Geochemical characterization
- Page 627 and 628:
P-505 Organic carbon composition an
- Page 629 and 630:
P-507 Dynamics of soil organic matt
- Page 631 and 632:
P-509 Exploiting isotopic, organic,
- Page 633 and 634:
P-511 The effect of soil moisture o
- Page 635 and 636:
P-513 Anaerobic oxidation of plant-
- Page 637 and 638:
P-515 Variability of terrestrially-
- Page 639 and 640:
Author Index 638
- Page 641 and 642:
Anselmetti Flavio S. O-63 Ansong Ge
- Page 643 and 644:
Brinkhuis Henk P-200, P-468 Britton
- Page 645 and 646:
de Souza Carvalho Ismar P-017 Dedys
- Page 647 and 648:
Francu Juraj P-037, P-266 Frank Ric
- Page 649 and 650:
Hart Malcolm O-09 Hartkopf-Fröder
- Page 651 and 652:
Jin Zhijun P-094 Jingjing Li P-179
- Page 653 and 654:
Lausmaa Jukka O-58 Lavrieux Marlèn
- Page 655 and 656:
Marsh Steven P-509 Marshall Chris O
- Page 657 and 658:
Nemchenko- Rovenskaya Alla P-112 Ne
- Page 659 and 660:
Radovic Miljana P-152 Ramanathan AL
- Page 661 and 662:
Schröder Jan P-020, P-029 Schubert
- Page 663 and 664:
Strelnikova Eugenia P-099 Stuart-Wi
- Page 665 and 666:
Wakeham Stuart G. O-69 Walters Clif
- Page 667 and 668:
Zhang Jing P-515 Zhang Jingru P-398