Full integrated annual report - African Bank - Investoreports
Full integrated annual report - African Bank - Investoreports
Full integrated annual report - African Bank - Investoreports

Create successful ePaper yourself
Turn your PDF publications into a flip-book with our unique Google optimized e-Paper software.
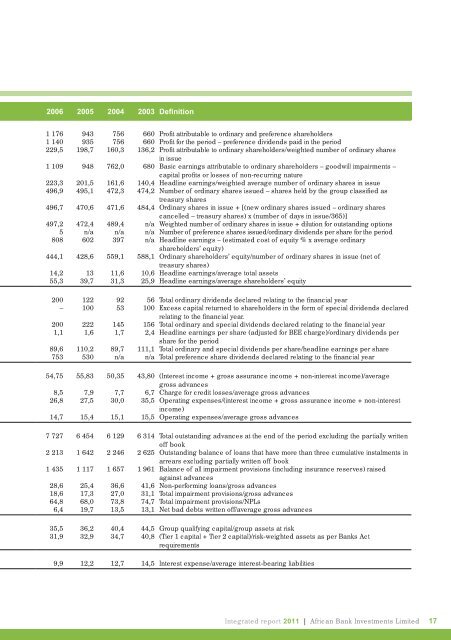
2006 2005 2004 2003 Defi nition<br />
1 176 943 756 660 Profi t attributable to ordinary and preference shareholders<br />
1 140 935 756 660 Profi t for the period – preference dividends paid in the period<br />
229,5 198,7 160,3 136,2 Profi t attributable to ordinary shareholders/weighted number of ordinary shares<br />
in issue<br />
1 109 948 762,0 680 Basic earnings attributable to ordinary shareholders – goodwill impairments –<br />
capital profi ts or losses of non-recurring nature<br />
223,3 201,5 161,6 140,4 Headline earnings/weighted average number of ordinary shares in issue<br />
496,9 495,1 472,3 474,2 Number of ordinary shares issued – shares held by the group classifi ed as<br />
treasury shares<br />
496,7 470,6 471,6 484,4 Ordinary shares in issue + [(new ordinary shares issued – ordinary shares<br />
cancelled – treasury shares) x (number of days in issue/365)]<br />
497,2 472,4 489,4 n/a Weighted number of ordinary shares in issue + dilution for outstanding options<br />
5 n/a n/a n/a Number of preference shares issued/ordinary dividends per share for the period<br />
808 602 397 n/a Headline earnings – (estimated cost of equity % x average ordinary<br />
shareholders’ equity)<br />
444,1 428,6 559,1 588,1 Ordinary shareholders’ equity/number of ordinary shares in issue (net of<br />
treasury shares)<br />
14,2 13 11,6 10,6 Headline earnings/average total assets<br />
55,3 39,7 31,3 25,9 Headline earnings/average shareholders’ equity<br />
200 122 92 56 Total ordinary dividends declared relating to the fi nancial year<br />
– 100 53 100 Excess capital returned to shareholders in the form of special dividends declared<br />
relating to the fi nancial year.<br />
200 222 145 156 Total ordinary and special dividends declared relating to the fi nancial year<br />
1,1 1,6 1,7 2,4 Headline earnings per share (adjusted for BEE charge)/ordinary dividends per<br />
share for the period<br />
89,6 110,2 89,7 111,1 Total ordinary and special dividends per share/headline earnings per share<br />
753 530 n/a n/a Total preference share dividends declared relating to the fi nancial year<br />
54,75 55,83 50,35 43,80 (Interest income + gross assurance income + non-interest income)/average<br />
gross advances<br />
8,5 7,9 7,7 6,7 Charge for credit losses/average gross advances<br />
26,8 27,5 30,0 35,5 Operating expenses/(interest income + gross assurance income + non-interest<br />
income)<br />
14,7 15,4 15,1 15,5 Operating expenses/average gross advances<br />
7 727 6 454 6 129 6 314 Total outstanding advances at the end of the period excluding the partially written<br />
off book<br />
2 213 1 642 2 246 2 625 Outstanding balance of loans that have more than three cumulative instalments in<br />
arrears excluding partially written off book<br />
1 435 1 117 1 657 1 961 Balance of all impairment provisions (including insurance reserves) raised<br />
against advances<br />
28,6 25,4 36,6 41,6 Non-performing loans/gross advances<br />
18,6 17,3 27,0 31,1 Total impairment provisions/gross advances<br />
64,8 68,0 73,8 74,7 Total impairment provisions/NPLs<br />
6,4 19,7 13,5 13,1 Net bad debts written off/average gross advances<br />
35,5 36,2 40,4 44,5 Group qualifying capital/group assets at risk<br />
31,9 32,9 34,7 40,8 (Tier 1 capital + Tier 2 capital)/risk-weighted assets as per <strong>Bank</strong>s Act<br />
requirements<br />
9,9 12,2 12,7 14,5 Interest expense/average interest-bearing liabilities<br />
Integrated <strong>report</strong> 2011 | <strong>African</strong> <strong>Bank</strong> Investments Limited<br />
17