Full integrated annual report - African Bank - Investoreports
Full integrated annual report - African Bank - Investoreports
Full integrated annual report - African Bank - Investoreports

Create successful ePaper yourself
Turn your PDF publications into a flip-book with our unique Google optimized e-Paper software.
64<br />
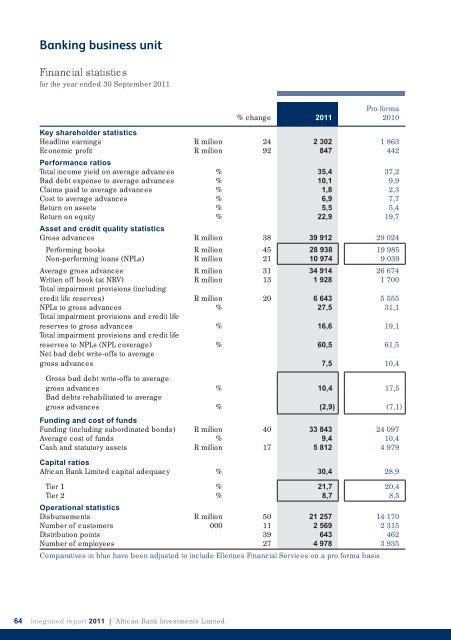
<strong>Bank</strong>ing business unit<br />
Financial statistics<br />
for the year ended 30 September 2011<br />
% change 2011<br />
Pro forma<br />
2010<br />
Key shareholder statistics<br />
Headline earnings R million 24 2 302 1 863<br />
Economic profi t<br />
Performance ratios<br />
R million 92 847 442<br />
Total income yield on average advances % 35,4 37,2<br />
Bad debt expense to average advances % 10,1 9,9<br />
Claims paid to average advances % 1,8 2,3<br />
Cost to average advances % 6,9 7,7<br />
Return on assets % 5,5 5,4<br />
Return on equity<br />
Asset and credit quality statistics<br />
% 22,9 19,7<br />
Gross advances R million 38 39 912 29 024<br />
Performing books R million 45 28 938 19 985<br />
Non-performing loans (NPLs) R million 21 10 974 9 039<br />
Average gross advances R million 31 34 914 26 674<br />
Written off book (at NRV) R million 13 1 928 1 700<br />
Total impairment provisions (including<br />
credit life reserves) R million 20 6 643 5 555<br />
NPLs to gross advances % 27,5 31,1<br />
Total impairment provisions and credit life<br />
reserves to gross advances % 16,6 19,1<br />
Total impairment provisions and credit life<br />
reserves to NPLs (NPL coverage) % 60,5 61,5<br />
Net bad debt write-offs to average<br />
gross advances 7,5 10,4<br />
Gross bad debt write-offs to average<br />
gross advances<br />
Bad debts rehabilitated to average<br />
% 10,4 17,5<br />
gross advances<br />
Funding and cost of funds<br />
% (2,9) (7,1)<br />
Funding (including subordinated bonds) R million 40 33 843 24 097<br />
Average cost of funds % 9,4 10,4<br />
Cash and statutory assets<br />
Capital ratios<br />
R million 17 5 812 4 979<br />
<strong>African</strong> <strong>Bank</strong> Limited capital adequacy % 30,4 28,9<br />
Tier 1 % 21,7 20,4<br />
Tier 2<br />
Operational statistics<br />
% 8,7 8,5<br />
Disbursements R million 50 21 257 14 170<br />
Number of customers 000 11 2 569 2 315<br />
Distribution points 39 643 462<br />
Number of employees 27 4 978 3 935<br />
Comparatives in blue have been adjusted to include Ellerines Financial Services on a pro forma basis<br />
Integrated <strong>report</strong> 2011 | <strong>African</strong> <strong>Bank</strong> Investments Limited